
Many people think of stock price as the major financial indicator for how a company is doing at the minute. In reality, stock price is a supply and demand for a share of a company that represents all future profits and growth. It's valuation.
Valuation has many facets which include relative comparisons to industry averages. It also includes cash flow, sustainable growth (internal and external), and general ratio analysis. Although there are macro economic factors like substitute products that can affect a company's value, most of the elements that a company can control are embedded in their financial statements.
Financial statements are required for publicly held companies and usually take the form of 10-Q and 10-K filings. There are other filings for non US-based companies, but they are very similar to the 10-Q/K statements. While there are also 8-K statements that show important changes and announcements a company is making, 10-Q/K statements show the major financial statements and other important information about the company. The 10-Q/K statements are created on a quarterly (Q) and annual (K) basis.
The major financial statements included in 10-Q/K filings are the Income Statement (Profit and Loss or P&L), the Balance Sheet (Statement of Financial Position), and the Statement of Cash Flows. Each of these statements has its own purpose, but interacts heavily with the others.
For each statement, there is a general accounting equation that describes the content:
- Income Statement: Revenues - Expenses = Profit/Loss
- Balance Sheet: Assets = Liabilities + Shareholder's Equity
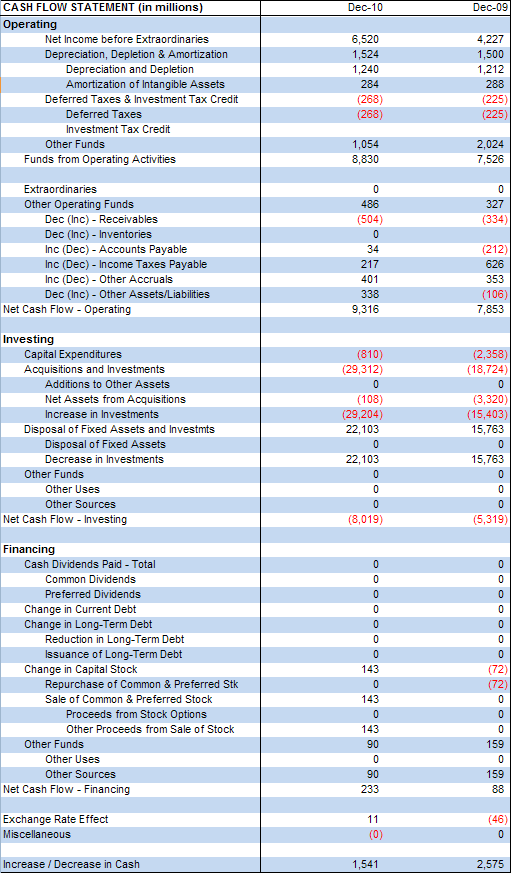
- Statement of Cash Flows: Operating Cash + Investing Cash + Financing Cash + Beginning Cash = Ending Cash
Example Income Statement

Example Balance Sheet

Example Cash Flow Statement
Financial Ratios are created from line items of the three financial statements previously mentioned. They can be grouped into six categories:
Liquidity
Ratio calculation- Current Ratio
- Quick Ratio
- Debt to Equity Ratio
- Receivables Turnover
- Fixed Asset Turnover
- Total Asset Turnover
- Days of Sales Outstanding (DSO)
- Debt Ratio
- Times Interest Earned (T.I.E.) Ratio
- Fixed Charge Coverage Ratio
- Net Profit Margin
- Return on Assets (ROA)
- Return on Equity (ROE)
- Price to Earnings (P/E) Ratio
- Cash Flow per Share Ratio
- Book Value per Share Ratio
- Market to Book Ratio
- Economic Value Added (EVA)
- Market Value Added (MVA)
- Internal Growth Rate (IGR)
- Sustainable Growth Rate (SGR)
- Price-to-Earnings to Growth (PEG) Ratio

There are many more ratios, but these are used quite a bit. There are expansions on ratios such as P/E -> PEG. One additional expansion ratio not previously mentioned that does carry some fame is the DuPont expansion of ROE. Its purpose is to give a better idea of what contributes to ROE by showing that ROE can be expanded to three separate other ratios if identical numerator/denominator pairs are not canceled out:

It is important to note that while the theory of each financial ratio is generally the same, they are sometimes calculated differently and must be compared only to other ratios that have been calculated in the same manner.
A company comparison using ratios

Again, it is important to stress that when making numeric comparisons, things are calculated in the same way. Use the numbers, management comments, and any other information you have, but remember that you will ultimately be making decisions based on this information and you must both understand it and take it with a grain of salt. Everyone ends up having their own interpretation.
No comments:
Post a Comment