
Everyone knows that finance and accounting deals with money. What they don't know is that these two subjects are not black and white. Assuming ethical behavior is taking place, there are three factors that make the numbers not so obvious, predictable, or in other words, black and white.
First, the interpretation of many measurements can vary because there is not a globally accepted way to calculate everything. Not only are there different accounting standards from country to country, the best way to calculate many financial ratios differs depending on who you talk to. There are also different algorithms to calculate items such as depreciation and inventory attributes. Knowing the general theory behind many financial ratios can lead to a more correct interpretation.
Second, assumptions are used to predict elements that are unknown. These assumptions are best guesses by individuals that themselves may not have all relevant information. Aside from discussions or critical thinking, assumptions can also come from a probability analysis based on best and worst case outcomes. A common simulation used to create these assumptions is the Monte Carlo method.
Third, the availability of inside information may not be widely known, but may contribute significantly to changes in the numbers. This factor can be hedged by having an understanding of annual and quarterly reports. One of the most important parts of annual and quarterly reports, besides the actual financial statements, is the Management Discussion and Analysis (MD&A). Management is required to divulge any important risks, benefits, or other factors that could affect the current state of the company or any official projections that have been made.
Show Me the (Real) Money
There are several things that everyone should know about a company in terms of its finances. The most important aspect of a company's finances is usually all about valuation.
Many people think of stock price as the major financial indicator for how a company is doing at the minute. In reality, stock price is a supply and demand for a share of a company that represents all future profits and growth. It's valuation.
Valuation has many facets which include relative comparisons to industry averages. It also includes cash flow, sustainable growth (internal and external), and general ratio analysis. Although there are macro economic factors like substitute products that can affect a company's value, most of the elements that a company can control are embedded in their financial statements.
Financial statements are required for publicly held companies and usually take the form of 10-Q and 10-K filings. There are other filings for non US-based companies, but they are very similar to the 10-Q/K statements. While there are also 8-K statements that show important changes and announcements a company is making, 10-Q/K statements show the major financial statements and other important information about the company. The 10-Q/K statements are created on a quarterly (Q) and annual (K) basis.
The major financial statements included in 10-Q/K filings are the Income Statement (Profit and Loss or P&L), the Balance Sheet (Statement of Financial Position), and the Statement of Cash Flows. Each of these statements has its own purpose, but interacts heavily with the others.
For each statement, there is a general accounting equation that describes the content:
Example Balance Sheet

Example Cash Flow Statement


There are many more ratios, but these are used quite a bit. There are expansions on ratios such as P/E -> PEG. One additional expansion ratio not previously mentioned that does carry some fame is the DuPont expansion of ROE. Its purpose is to give a better idea of what contributes to ROE by showing that ROE can be expanded to three separate other ratios if identical numerator/denominator pairs are not canceled out:

It is important to note that while the theory of each financial ratio is generally the same, they are sometimes calculated differently and must be compared only to other ratios that have been calculated in the same manner.

Again, it is important to stress that when making numeric comparisons, things are calculated in the same way. Use the numbers, management comments, and any other information you have, but remember that you will ultimately be making decisions based on this information and you must both understand it and take it with a grain of salt. Everyone ends up having their own interpretation.
Many people think of stock price as the major financial indicator for how a company is doing at the minute. In reality, stock price is a supply and demand for a share of a company that represents all future profits and growth. It's valuation.
Valuation has many facets which include relative comparisons to industry averages. It also includes cash flow, sustainable growth (internal and external), and general ratio analysis. Although there are macro economic factors like substitute products that can affect a company's value, most of the elements that a company can control are embedded in their financial statements.
Financial statements are required for publicly held companies and usually take the form of 10-Q and 10-K filings. There are other filings for non US-based companies, but they are very similar to the 10-Q/K statements. While there are also 8-K statements that show important changes and announcements a company is making, 10-Q/K statements show the major financial statements and other important information about the company. The 10-Q/K statements are created on a quarterly (Q) and annual (K) basis.
The major financial statements included in 10-Q/K filings are the Income Statement (Profit and Loss or P&L), the Balance Sheet (Statement of Financial Position), and the Statement of Cash Flows. Each of these statements has its own purpose, but interacts heavily with the others.
For each statement, there is a general accounting equation that describes the content:
- Income Statement: Revenues - Expenses = Profit/Loss
- Balance Sheet: Assets = Liabilities + Shareholder's Equity
- Statement of Cash Flows: Operating Cash + Investing Cash + Financing Cash + Beginning Cash = Ending Cash
Example Income Statement

Example Balance Sheet

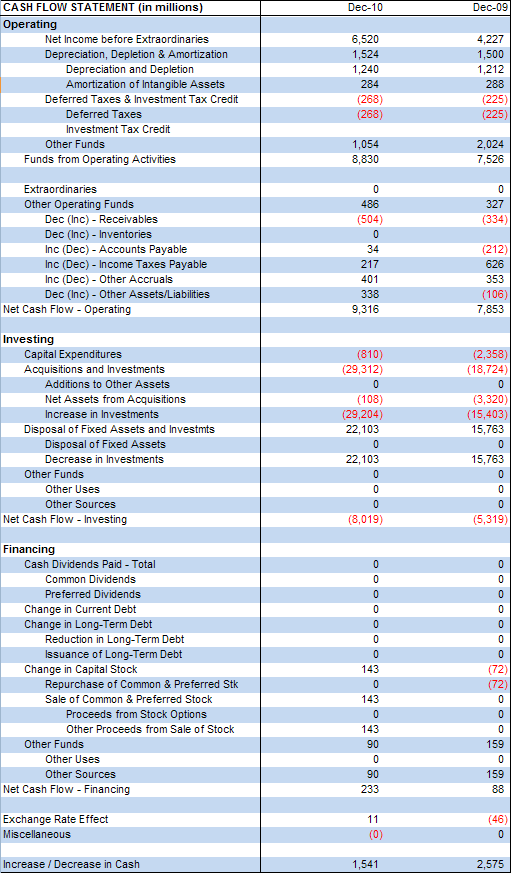
Example Cash Flow Statement
Financial Ratios are created from line items of the three financial statements previously mentioned. They can be grouped into six categories:
Liquidity
Ratio calculation- Current Ratio
- Quick Ratio
- Debt to Equity Ratio
- Receivables Turnover
- Fixed Asset Turnover
- Total Asset Turnover
- Days of Sales Outstanding (DSO)
- Debt Ratio
- Times Interest Earned (T.I.E.) Ratio
- Fixed Charge Coverage Ratio
- Net Profit Margin
- Return on Assets (ROA)
- Return on Equity (ROE)
- Price to Earnings (P/E) Ratio
- Cash Flow per Share Ratio
- Book Value per Share Ratio
- Market to Book Ratio
- Economic Value Added (EVA)
- Market Value Added (MVA)
- Internal Growth Rate (IGR)
- Sustainable Growth Rate (SGR)
- Price-to-Earnings to Growth (PEG) Ratio

There are many more ratios, but these are used quite a bit. There are expansions on ratios such as P/E -> PEG. One additional expansion ratio not previously mentioned that does carry some fame is the DuPont expansion of ROE. Its purpose is to give a better idea of what contributes to ROE by showing that ROE can be expanded to three separate other ratios if identical numerator/denominator pairs are not canceled out:

It is important to note that while the theory of each financial ratio is generally the same, they are sometimes calculated differently and must be compared only to other ratios that have been calculated in the same manner.
A company comparison using ratios

Again, it is important to stress that when making numeric comparisons, things are calculated in the same way. Use the numbers, management comments, and any other information you have, but remember that you will ultimately be making decisions based on this information and you must both understand it and take it with a grain of salt. Everyone ends up having their own interpretation.
Strategy Performance Part II 09 December, 2010
Even though most people are concerned about their own health, I'm guessing that a small percentage of those people don't really think about the health of the company they work for. I would argue that although many employees are constantly searching for that next innovation, simple process improvement would improve the average company just as much.
Process improvement is not only about improving, it's also about knowing what is possible. A process is working well if it consistently performs well, and has a low level of daily variance. When looking at a company checkup in terms of its process health, the investment in improvement is not as expensive as first impressions may indicate. In fact, many studies show that it is not the willingness or ability to improve, but the time required that is often the problem.
Four main goals of process improvement are:
Two popular ways of improving processes are benchmarking and waste identification. Either way, it's all about removing things that do not add value and adding more value where it is needed.
Benchmarking is all about using metrics to grade a process. These grades can then be compared to either other internal benchmark grades or external benchmark grades dealing with similar processes. Internal comparisons are used for continuous improvement from where the company was previously at. External comparisons are used to find out how well a process compares to the best versions of those processes on a local, national, or even global scale.
Benchmarking and process improvement is comprised of the following steps:

Cause and Effect diagrams are useful for finding root causes to problems. Looking at the following diagram, you can see why some people call it a fishbone diagram. Every time there is a reason for the effect, an attempt is made to find a lower level cause.

Pareto charts are cross plots of specific problem types vs total problems (relative vs. absolute). They are useful in showing which problem areas should be addressed first.
If it is uncertain whether a process needs to be benchmarked or improved, try looking at that process from a customer's perspective and see if you would be impressed or left wanting.
Process improvement is not only about improving, it's also about knowing what is possible. A process is working well if it consistently performs well, and has a low level of daily variance. When looking at a company checkup in terms of its process health, the investment in improvement is not as expensive as first impressions may indicate. In fact, many studies show that it is not the willingness or ability to improve, but the time required that is often the problem.
Four main goals of process improvement are:
- Cutting costs
- Cutting waste
- Improving quality
- Removing stress
Two popular ways of improving processes are benchmarking and waste identification. Either way, it's all about removing things that do not add value and adding more value where it is needed.
Benchmarking is all about using metrics to grade a process. These grades can then be compared to either other internal benchmark grades or external benchmark grades dealing with similar processes. Internal comparisons are used for continuous improvement from where the company was previously at. External comparisons are used to find out how well a process compares to the best versions of those processes on a local, national, or even global scale.
Benchmarking and process improvement is comprised of the following steps:
- Talk to those dealing with the process (to gain information and buy-in)
- Create metrics for comparing improvement levels
- Collect metrics before a change (as the process exists today)
- Make the change
- Collect metrics after a change
- Make sure the improvements and measurements are statistically significant
- Present findings, real world benefits, and recommendations
- Officially incorporate the changes into the process
- When needed, benchmark again for continued improvement
- Time
- Number of people involved
- Number of manual steps
- Number of communication methods or problems
- Amount of redundancy
- Transportation (moving things more than needed)
- Inventory (any unneeded storage or depreciation)
- Motion (people moving more than needed)
- Waiting
- Over production (making more than needed)
- Over processing (poor tool use)
- Defects (taking extra time to find defects and fix them)
- Underutilized resources
- Process Diagrams & Value Stream Mapping
- Cause and Effect (also known as either Fishbone or Ishikawa diagrams)
- Pareto Charts / Analysis

Cause and Effect diagrams are useful for finding root causes to problems. Looking at the following diagram, you can see why some people call it a fishbone diagram. Every time there is a reason for the effect, an attempt is made to find a lower level cause.

Pareto charts are cross plots of specific problem types vs total problems (relative vs. absolute). They are useful in showing which problem areas should be addressed first.

If it is uncertain whether a process needs to be benchmarked or improved, try looking at that process from a customer's perspective and see if you would be impressed or left wanting.
Strategy Performance 07 December, 2010
After strategies have been created and a direction has been set, a company must perform well to see the desired results. One popular way to measure strategy performance is by using a Balanced Scorecard (BSC).
The BSC was popularized by Robert Kaplan and David Nortan in 1992. It is similar to a dashboard, but with a focus on company and consumer trade-offs. Stress is placed on an informing purpose rather than a controlling one. It can be thought of as a way to measure strategy because it links a company's actions to its mission and vision.
Balanced Scorecards are created based on four quadrants:
Each of these quadrants are further broken down into:
Goals should be specific, but cover many parts of each quadrant such as:

There are many benefits to the BSC which include:
The BSC was popularized by Robert Kaplan and David Nortan in 1992. It is similar to a dashboard, but with a focus on company and consumer trade-offs. Stress is placed on an informing purpose rather than a controlling one. It can be thought of as a way to measure strategy because it links a company's actions to its mission and vision.
Balanced Scorecards are created based on four quadrants:
- Internal Processes (how efficient are you at satisfying customers?)
- Customers (how do customers see you?)
- Finances (how do shareholders see you?)
- Internal Learning and Innovation (how can you create more value?)
Each of these quadrants are further broken down into:
- Goals
- Measurements
Goals should be specific, but cover many parts of each quadrant such as:
- Short/Long Term
- Financial/Non-Financial
- Leading/Lagging Indicators
- Internal/External Indicators
The following flow shows how the BSC connects strategy to action.

There are many benefits to the BSC which include:
- Showing the impact one change has on other quadrants
- The ability to measure intangible assets
- People are pulled towards the company mission and vision
- Areas that seem disjoint, but are linked, are identified
- Everyone in the company is involved
- Cause and effect relationships between BSC goals and outcomes are identified
- It shows which changes are reflected in the bottom line
- Goals should always be linked to the strategy
- Cause and effect relationships between goals and outcomes should be validated
- Measurements must be valid and statistically significant
- The goals should be communicated throughout the entire company
- Time should be taken to understand how quadrants and quadrant goals are related
Outlining the Marketing Plan 26 August, 2010
Here's an outline for a marketing plan.
Some parts will be longer, others may only be a sentence or even be non-existent.
It's better to avoid 'I', 'we', and 'you', but if you find yourself frustrated or stumbling on these aspects, drop them in favor of smoothness. The meat of the plan and the part that will be of interest to most people will be that of section 'I', which may be the majority of the summary in section 'A'. The rest of the plan is backing, justification, and proof that section 'I' will succeed. Section 'I' explains the actual product, as well as the major assumptions.
A - Executive Summary
1 - State the product, it’s name, the company name, and who your market is
2 - Give a brief overview of the whole plan
a - Summarize assessments
b - Summarize goals
c - Summarize recommendations
B - Introduction
C - Customer Analysis
1 - Customer identification/definition
2 - Customer demographics, needs assessment, and decision-making
a - Detail the market vs general target segments
b - Describe Industry worth
c - How many potential customers are there?
d - How is the potential customer base changing?
e - Explain the target customers’ demographics
f - Detail the target customers’ psychographics
g - Detail the target customers’ geographics
h - Detail the needs of the target customers
i - Detail the drivers of the customers’ decision-making
j - What will make consumers choose this product
k - Are the target market’s decisions influenced by others
l - What impact will the product have on the target market
m - How much education & change will need to take place
n - Detail customers’ price and augmented product’s preferences
o - Detail service required
3 - Comprehensive profiles of a company’s target customers
4 - Detail any partners and partner’s decision making process or show there are none
D - Current marketing Situation Analysis
1 - Market overview/brief description & the company’s place in the market
2 - Product line overview
a - What other products does the company have?
b - Where does the new product fit into the existing line?
3 - External Analysis (SLEPT/Partial Porters)
a - Social (trends & their effects)
b - Legal (regulations, labor unions)
c - Economic
i - supply, demand, equilibrium
ii - vulnerability to preference changes
iii - fiscal, monetary, inflation, unemployment
d - Political (federal, local, favor of political party to industry, political changes)
e - Technological
i - evolution, choices available
ii - technological leads, innovation, can we keep up?
f - Industry
i - Show the leader in the market
ii - Show recent changes in power/trends in competition
g - Customers
i - How are demands changing over time?
ii - Is the company or consumer in power?
h - Suppliers
i - Show partners/value adding groups
ii - Is the company or supplier in power?
i - New industry entrants
i - How are the barriers to entry?
ii - Are there many new entrants?
4 - Internal Analysis
a - Resourced based view
b - Functional view
c - Value-chain
d - Competency matrix
e - Building blocks of competitive advantage
E - SWOT
F - Competitive Analysis
1 - Define what kinds of competition exist
a - Substitutes (direct)
b - In house or other (indirect)
2 - Describe competitors and show competitive advantage
a - Define each direct competitor individually
i - Strengths
ii - Weaknesses
iii - How do they satisfy the target market’s needs?
b - Group and categorize each major competitor
c - Describe the company’s competitive advantages
i - Efficiency
ii - Quality
iii - Innovation
iv - Responsiveness to customers
v - Providing incentives
vi - Access to limited or exclusive resources
G - Distribution overview
1 - Describe existing distribution channels and their effectiveness
2 - Describe trends in sales of similar products
3 - Overview of if the product will be sold in similar fashion to others
4 - Ordering
H - Place in the market
1 - Overview of company strategy
2 - List goals
3 - Issues affecting goal accomplishment
I - Marketing Strategy (What do to based on what was already stated/How to do it)
1 - Value Proposition/Product
a - Describe the core product
b - Describe the augmented product
c - What need will it satisfy
d - Why will a consumer choose this product?
e - Evolution of the product/it's successors
2 - Segmentation
a - Describe your market and detail how you will segment it
b - Justify why the market will be segmented in this way
c - Describe the segmentation variables and the segment’s differences
d - Describe why other segments are not being targeted
3 - The Rest of the Marketing mix
a - Price
i - Value of new offering
ii - Difference between new offering and what exists
iii - Pricing strategy
b - Place/distribution
i - Sales plan
ii - Sales forecast
c - Promotion
i - Acquiring customers
ii - Retaining customers
iii - Education
iv - Facts
4 - Marketing research needed
5 - Time Lines
J - Action & Control
1 - Action Program
a - List the first year’s initiatives
b - Estimate at what time each will be done in relation to other things
c - Estimate how long they will take
2 - Controls
a - What checkpoints are necessary to make sure everything is on track?
b - How will changes in the environment be handled?
c - What will be measured?
K - Conclusion
Brand: It's All In Your Head 16 July, 2010
A company's brand is simply what a consumer thinks of a company and it's products. It represents a set of promises that a company makes to a consumer.
Brand equity consists of assets and liabilities linked to a brand that change the value of a product. It can also be thought of as the value of the company if the firm's total asset value was subtracted from the firms estimated value.
Building a brand can trump everything else in marketing, for better or for worse. Brands have the ability to create customer loyalty, lower competition, create larger margins, lower price sensitivity of products, create greater trade, create better communication effectiveness, and create brand extension opportunities.
The key to branding: The power of a brand is in the mind of the consumer
From a practical standpoint, consumers will rate a brand based on three things:
1 - The expertise of the company
2 - The similarity of products produced
3 - The absence of brand extension exploitation
Many characteristics and features that augment a product, such as warranty time, can affect branding. Popular culture, influencers, customers, and the firm can influence the culture or story behind a brand.
The value of a brand can be measured in four parts:
1 - Reputation
2 - Relationship
3 - Experience
4 - Symbolism
The Young and Rubicam Group have four ideas that when measured, can determine the health of a brand:
1 - Differentiation
2 - Relevance
3 - Esteem
4 - Knowledge
When differentiation is greater than relevance, the brand can grow. Otherwise, it cannot. When esteem is greater than knowledge, the customer will want a closer relationship. Otherwise, it will not. Brand strength is the combination of differentiation and relevance. Brand stature is the combination of esteem and knowledge.
Kevin Keller developed a model called the Customer Based Brand Equity (CBBE) Pyramid. It has the goal of allowing a company to:
1 - Decide what the brand should mean
2 - Develop a link between the brand and the product
3 - Get positive reactions
4 - Build lasting customer relationships
Figure 1 - CBBE Pyramid

The definitions that follow describe the CBBE pyramid, and can be though of in terms of understanding nomenclature. To communicate an idea, sometimes certain words or phrases are used, and in the beginning, synonyms are the only way a person has of understanding what the initial words or phrases mean. The following definitions will be defined by their synonyms because it seems this is the most effective way to talk about these brand ideas.
Brand Salience - Identity & awareness. It shows what basic functions the brand provides. It also allows the consumer to see new usage situations that were previously ignored or forgotten.
Brand Performance & Imagery - Meaning & associations. Performance is all about functional needs. This includes quality, utility, asthetics, and economic needs. It includes primary and secondary functions as well as reliability, servicability (effectiveness, efficiency, and empathy), and durability. It also includes style, design, and price.
Imagery is all about psychological and social needs. It is about user profiles, purchase scenarios, usage scenarios, personality, values, history, heritage, and experiences.
Both Performance and imagery can be profiled by looking at three main categories: Strength, Favorability, and Uniquness in that order.
Consumer Judgements & Feelings - The effects that the knowledge and product a company publicizes has on consumers. Quality, credibility, consideration, and superiority are judgement attributes. Warmth, fun, excitement, security, social approval, and self-respect are feeling attributes.
Consumer Brand Resonance - Brand loyalty. This means behavior loyalty, bonding attitudes, a sense of community, and active engagement.
A consumer cannot have brand loyalty to all the brands they come in contact with. This is due to both conflicting allegiances and personal differences and preferences. This links nicely with Jennifer Aaker's theory on brand personality. The theory states that if people choose friends based on personality, they should be able to choose products and services based on some similar personality. Doing this generally involves surveys that ask questions falling into the following categories (thus showing a product's personality) :
1 - Sincerity
2 - Excitement
3 - Competence
4 - Sophistication
5 - Ruggedness
Another method used in gaining consumer insights is the ZMET (Zaltman Metaphor Elicitation Technique). This method has a consumer gather images about a brand or product, and then use those images to tell a story. Missed images, sensory images, and image groups are also discussed. This method's main benefit is removing the constraints on voice/language and the asking of specific questions in gaining insights. It helps consumers say what they want to without putting their ideas into words.
The Link Between Consumers and Brands - A brand should help a consumer remember and understand the differences between a competitors brand and your brand.
Brands should:
- Suggest something about the product's benefits and qualities
- Be easy to pronounce recognize and remember
- Be distinctive
- Be extensible
- Translate into foreign languages
- Be capable of registration and legal protection
Brands must continually be built even if they are already strong. Competitive and consumer shifts can occur, and change everything. The time it takes to build a brand will be proportional to the time it takes to create enough awareness and understanding with consumers. In the end, it's what the consumer thinks that makes or breaks a firm.
Marketing and the Yardstick 15 July, 2010
Why should anyone measure marketing? The 'why measure' answer is pretty obvious, but the fact that marketing is being measured is interesting. Marketing costs a lot. Brand health + marketing = the company's reputation. Finally, the customer is usually the source of all cash for the company.
It's important to ask how the customer's needs are changing, how the firm can be loyal to the customer, and how marketing effectiveness can be measured in terms of the bottom line.
One way to create and understand measurements is by using a dashboard. A dashboard is simply a set of indicators that can be glanced at and absorbed quickly. There are several points to be made when talking about dashboards. Not a lot of explanation is needed. Use the following list as a dashboard creation guide, and the result will be above average.
- Don't overload it with too much information.
- Include operational, financial, customer, and quality metrics.
- Include driver, pipeline, resource, and talent information.
- Include innovation information.
- Show how the entire company as a whole is doing.
- Visualizations should be simple and easy to digest.
- Use a combination of historical data and leading indicators.
- Focus on leading indicators.
- Metrics should be as real time as possible.
- Only show controllable metrics.
- Use baselines to allow the flagging of extraordinary results.
- Echo corporate strategy in the metrics.
- Measure short and long term goal metrics.
- Create standard definitions for metrics.
- Verify metrics are absolutely correct.
- Allow for an audit trail to see the details.
- Casual (cause and effect) measurements should be used.
- Verify that the metrics matter.
- Measurement methods must be consistent across the company.
- Results should be shared.
- Results should be acted upon.
- Metrics should expose inadequacies.
There's the list.
A Smattering Description of 'Promotion' (IMC)
Marketing promotion/communications (often called Integrated Marketing Communications or IMC) can have several forms. Advertising, PR, value chain discounts, sales promotions, personal selling, in store displays and kiosks, direct marketing, and samples are some examples of IMC. This is really where marketing affecting consumers. Consumers must know about a product before they decide to purchase it. Push strategies attempt to keep contacting a consumer in hopes that they will buy the product. Pull strategies are focused on creating enough demand that consumers purchase a product with out being reminded to do so.
Public relations (PR) includes marketing communications and promotion by means of press releases, speeches, and service activities. While this can be a great and cheap way of gaining publicity, there is no guarantee that the publicity will be good. News agencies are entitled to interpret and show PR as they deem fit.
It is important to remember that when thinking about marketing communications, advertising should usually win out over promotions. Promotions will create a lift over the usual baseline profits, but this is generally short lived. Given price fluctuations that promotions create, the price sensitivity of a product goes up and the price premium that a brand can command will decrease.
While promotions can bring in extra money, they are usually thought of as short term solutions. Advertising products or a brand is thought of as a long term solution. The profits from advertising may not be as evident as in promotions, but it does lead a firm down the path of long term success.
The biggest hurdles to cross when advertising are identifying the target audience. After this has been done it is necessary to inform them, give them a trial experience, or get them to repurchase a product. The final step is creating the advertisement. This is usually done with one of the following goals:
- Educating consumers (product purpose and differentiation)
- Appealing to humor
- Appealing to fears
- Adding a belief to a consumer's mindset
- Conditioning
- Repetition
- Endorsements
Adding beliefs are important because it can be counter productive to attempt to change a person's beliefs.
It's also important to not forget the power of buzz and communities. They can alter the perception and hype of a product immensely.
Although IMC is one of the original 4 parts of the marketing mix and can sometimes include both promotion and placement, many companies will outsource it to avoid becoming an advertising agency themselves.
A Smattering Description of 'Price'
Price is some compensation that is exchanged by two parties. In internal business, it's all about the price.
Aside from price being a factor of purchase, there are several other functions it serves. Determining profits, sales, market share, and store traffic are a few. It creates a perception of quality or exclusiveness. It can encourage trials, and discourage competition.
There are several pricing strategies that should be considered when pricing products. These will be given in a list form because there are so many.
Cost-Plus Pricing: The cost of a product + a percent markup. This strategy ignores many environmental factors, but guarantees profits if sales are made.
Price Skimming: The price is initially set high to gain extra profits from early adopters, but set lower as more competition enters. This can work, but invites competition.
Penetration Pricing: The start cost is lower to help enter the market. Most profits are made by not raising the price, but by cutting costs.
Prestige Pricing: Creating a perception in the consumer's mind that quality is high, and they must pay a higher price for the product.
Bait and Hook: The initial price of the main product is low, but replacement parts and other materials or services consumed in the process have higher prices. This works unless a competitor can create low priced replacement parts and materials.
Price Promotions: This can be used to introduce new products or prevent consumers from defecting. It is also effective in selling older products when newer ones are available. Too many price promotions can cause consumers to wait and only purchase when there is a promotion, or switch between brands, cycling through promotions.
According to Robert Dolan's true economic value (TEV) theory, consumers are only willing to pay the cost of the best alternative + the value of the performance difference. This can be useful in setting an initial price for a product based on what consumers are currently buying. When setting initial prices, it is important to be clear on what market segment is being targeted.
Companies must revisit pricing strategies often and make sure they correspond to where the product is in the product life-cycle.
The Strategic Pricing Group created a pyramid that can be used as a framework to not only set a price for a product, but to have resources and a company capable of backing that price up.

1 - Value Creation: A product must be created and priced so a customer will pay for it, not simply be satisfied by it.
2 - Price Structure: Pricing should be based on the value received instead of the product delivered. Price for a customer segment rather than a product.
3 - Price and Value Communication: When value is not communicated, the doors to price sensitivity and price negotiations open. This becomes problematic. Having a communications strategy that uses both performance facts as well as psychological benefits will help solidify a value to a consumer.
4 - Pricing Policy: A stance must be taken on the frequency of discounts and promotions given. If this is not done, the customer base will drive profits down faster than the general efficient market.
5 - Price Level: Actual prices must be set and periodically reviewed in the same way throughout the company. This can take the form of a planned decision model that uses relevant data about how the market will respond to changes. Many times the best model is simply a fixed price/variable offering one.
These 5 steps should be consistently known throughout the organization.
What has been stated up until now has largely been academic in nature. It is now necessary to turn attention to a customer's view of their willingness to buy.
Consumers will buy a product based on:
1 - When its perceived value exceeds its price.
2 - Fairness compared to another consumer's purchase or a producer's cost.
3 - Incentives relative to the price.
4 - Reference prices such as the last known sale or purchase price.
5 - Perceived exploitation of the consumer.
Consumers will remain customers if they know there is value in the product. Remembering that a product has value includes:
1 - Actually using a previously purchased product.
2 - Understanding per line item if there are parts, what the cost is.
3 - Paying for the product close to the time of use, which enforces the product's value.
Pricing can make or break a product line even if the products are great. These steps will help act as a guide, making sure the price matches not only the product, but the market.
Aside from price being a factor of purchase, there are several other functions it serves. Determining profits, sales, market share, and store traffic are a few. It creates a perception of quality or exclusiveness. It can encourage trials, and discourage competition.
There are several pricing strategies that should be considered when pricing products. These will be given in a list form because there are so many.
Cost-Plus Pricing: The cost of a product + a percent markup. This strategy ignores many environmental factors, but guarantees profits if sales are made.
Price Skimming: The price is initially set high to gain extra profits from early adopters, but set lower as more competition enters. This can work, but invites competition.
Penetration Pricing: The start cost is lower to help enter the market. Most profits are made by not raising the price, but by cutting costs.
Prestige Pricing: Creating a perception in the consumer's mind that quality is high, and they must pay a higher price for the product.
Bait and Hook: The initial price of the main product is low, but replacement parts and other materials or services consumed in the process have higher prices. This works unless a competitor can create low priced replacement parts and materials.
Price Promotions: This can be used to introduce new products or prevent consumers from defecting. It is also effective in selling older products when newer ones are available. Too many price promotions can cause consumers to wait and only purchase when there is a promotion, or switch between brands, cycling through promotions.
According to Robert Dolan's true economic value (TEV) theory, consumers are only willing to pay the cost of the best alternative + the value of the performance difference. This can be useful in setting an initial price for a product based on what consumers are currently buying. When setting initial prices, it is important to be clear on what market segment is being targeted.
Companies must revisit pricing strategies often and make sure they correspond to where the product is in the product life-cycle.
The Strategic Pricing Group created a pyramid that can be used as a framework to not only set a price for a product, but to have resources and a company capable of backing that price up.
Figure 1 - The Strategic Pricing Pyramid

1 - Value Creation: A product must be created and priced so a customer will pay for it, not simply be satisfied by it.
2 - Price Structure: Pricing should be based on the value received instead of the product delivered. Price for a customer segment rather than a product.
3 - Price and Value Communication: When value is not communicated, the doors to price sensitivity and price negotiations open. This becomes problematic. Having a communications strategy that uses both performance facts as well as psychological benefits will help solidify a value to a consumer.
4 - Pricing Policy: A stance must be taken on the frequency of discounts and promotions given. If this is not done, the customer base will drive profits down faster than the general efficient market.
5 - Price Level: Actual prices must be set and periodically reviewed in the same way throughout the company. This can take the form of a planned decision model that uses relevant data about how the market will respond to changes. Many times the best model is simply a fixed price/variable offering one.
These 5 steps should be consistently known throughout the organization.
What has been stated up until now has largely been academic in nature. It is now necessary to turn attention to a customer's view of their willingness to buy.
Consumers will buy a product based on:
1 - When its perceived value exceeds its price.
2 - Fairness compared to another consumer's purchase or a producer's cost.
3 - Incentives relative to the price.
4 - Reference prices such as the last known sale or purchase price.
5 - Perceived exploitation of the consumer.
Consumers will remain customers if they know there is value in the product. Remembering that a product has value includes:
1 - Actually using a previously purchased product.
2 - Understanding per line item if there are parts, what the cost is.
3 - Paying for the product close to the time of use, which enforces the product's value.
Pricing can make or break a product line even if the products are great. These steps will help act as a guide, making sure the price matches not only the product, but the market.
A Smattering Description of 'Product' 14 July, 2010
Products can often be though of as bundles of consumer benefits. The core benefit is really what the consumer is buying. Products can be end results. They can be services or physical objects. According to Michael Solomon, they can even be people, places, and ideas.
Products are an interesting part of the marketing mix (product, price, promotion, and sometimes placement) because products are the most difficult to change after they have been planned and manufactured.
Products have elements of convenience, shopping, specialty, low & high involvement, function, and emotion. It is important to market these factors correctly because by default, not everyone will place a product in the same categories.
Brand, delivery, installation, customer service, warranties, and payment methods are some examples of how a product can be augmented. As a product becomes more mainstream, augmentation will become more important as a differentiator.
The speed of adoption is critical when computing the time at which a product's/product mix's income will have passed development costs and surface as profit. Rogers created the ACCORD acronym to show influencers of adoption:
A - Advantage (superiority)
C - Compatibility (with the consumer)
C - Complexity (understandability and use)
O - Observability (of adoption by others)
R - Riskiness (consequences of adoption)
D - Divisibility (gradual adoption)
There are several attributes used to describe a product line. These attributes can help a marketer decide how to communicate differences from one product to another:
Breadth: Number of product lines.
Depth, Length: Number of products within a line.
Horizontal dimension: Differentiation by consumer taste.
Vertical dimension: Differentiation by performance and price.
Continuous innovation: An improvement to how something is currently done.
Discontinuous innovation: A new way of doing something.
First you generate ideas. After amassing a number of ideas, those ideas are screened. The ideas that remain are fleshed out into concepts. When you have screened concepts, it is a good time to start getting market feedback. With that feedback in mind, a marketing strategy is defined and a business case is built for a rough idea of whether or not the concept is profitable. Product development then begins. Depending on the cost of product development, an amount of test marketing takes place during the product development. Finally, commercialization occurs and the product is released.
A process for product development:
Two parts to the above list may not be obvious at first:
Go/No-Go decisions must not be based on passing simple hurdles, some metrics may be needed.
Also, the product must fit the company and it's mission.
Consumers will compare products to competing products. If no competition for a product exists, consumers will compare the new product to the current way of doing things without the new product.
In theory, product life-cycles generally follow a development, introduction, growth, maturity, and decline stage.

In practice they fluctuate based on fads, urgent needs, competition, education about the product, and abstract or paradigm shifting products. In fact, Frank Bass created an abstract model that can give an idea of product demand and sales to interested parties:

At the end of the day, some products may have little demand. Even those products with little demand should be maintained as long as they bring in enough to cover their costs. This is done to placate consumers who have already purchased older products and may feel like they have been abandoned or that what they have is obsolete if the product is discontinued. Then again, maybe that's the marketing spin you want.
Products are an interesting part of the marketing mix (product, price, promotion, and sometimes placement) because products are the most difficult to change after they have been planned and manufactured.
Products have elements of convenience, shopping, specialty, low & high involvement, function, and emotion. It is important to market these factors correctly because by default, not everyone will place a product in the same categories.
Brand, delivery, installation, customer service, warranties, and payment methods are some examples of how a product can be augmented. As a product becomes more mainstream, augmentation will become more important as a differentiator.
The Product Mix
A product mix is made up of all product lines. A product line is a number of products that have a similar function, style, manufacturing process, distribution process, consumption method, or market segment. These exist so a firm can satisfy multiple market segments at once.The speed of adoption is critical when computing the time at which a product's/product mix's income will have passed development costs and surface as profit. Rogers created the ACCORD acronym to show influencers of adoption:
A - Advantage (superiority)
C - Compatibility (with the consumer)
C - Complexity (understandability and use)
O - Observability (of adoption by others)
R - Riskiness (consequences of adoption)
D - Divisibility (gradual adoption)
There are several attributes used to describe a product line. These attributes can help a marketer decide how to communicate differences from one product to another:
Breadth: Number of product lines.
Depth, Length: Number of products within a line.
Horizontal dimension: Differentiation by consumer taste.
Vertical dimension: Differentiation by performance and price.
Continuous innovation: An improvement to how something is currently done.
Discontinuous innovation: A new way of doing something.
New Product Development
New product development should always be taking place. Although many innovations become apparent after consumers are exposed to them, innovations and products alone cannot create demand. Consumers must want or need a product once it exists.First you generate ideas. After amassing a number of ideas, those ideas are screened. The ideas that remain are fleshed out into concepts. When you have screened concepts, it is a good time to start getting market feedback. With that feedback in mind, a marketing strategy is defined and a business case is built for a rough idea of whether or not the concept is profitable. Product development then begins. Depending on the cost of product development, an amount of test marketing takes place during the product development. Finally, commercialization occurs and the product is released.
A process for product development:
- Observe the situations of consumers
- Generate ideas
- Screen concepts
- Research concept components
- Create go/no-go decision points
- Analyze the product's business model
- Prototype
- Test the market
- Promote/Distribute
Two parts to the above list may not be obvious at first:
Go/No-Go decisions must not be based on passing simple hurdles, some metrics may be needed.
Also, the product must fit the company and it's mission.
Consumers will compare products to competing products. If no competition for a product exists, consumers will compare the new product to the current way of doing things without the new product.
In theory, product life-cycles generally follow a development, introduction, growth, maturity, and decline stage.

In practice they fluctuate based on fads, urgent needs, competition, education about the product, and abstract or paradigm shifting products. In fact, Frank Bass created an abstract model that can give an idea of product demand and sales to interested parties:
| a | = | Consumers making up their minds independently |
| b | = | Consumers who act on word of mouth |
| Bt | = | Consumers to date who purchased the product |
| M | = | All consumers in the Product's market |
At the end of the day, some products may have little demand. Even those products with little demand should be maintained as long as they bring in enough to cover their costs. This is done to placate consumers who have already purchased older products and may feel like they have been abandoned or that what they have is obsolete if the product is discontinued. Then again, maybe that's the marketing spin you want.
Decisions, Decisions, Decisions 13 July, 2010
Decisions are made by people all day, and every day. A key question for marketers then becomes "How can we influence those decisions in our favor?" Interestingly, the answer is more defined than one might think. There is a pattern that most people follow when making decisions. The steps are outlined below.
1. Problem recognition - This is caused by seeing a difference in reality and ideal. A marketing message can cause a customer to recognize this difference.
2. Information search - Consumers identify solutions based on memories or the external environment. Marketing communicates information about products in hopes of leaving the consumer with good memories of it's product.
3. Evaluation of alternatives - Consumers narrow down solutions based on what they like, as well as what is feasible. Marketing attempts to get consumers to use evaluative criteria that is in their favor.
4. Product choice - Consumers use heuristics to make a final decision. Marketing attempts to communicate which heuristics are important. Examples are price equals quality, brand loyalty, and country of origin matters.
5. Post-purchase evaluation - Consumers decide if the decision they made was a good one. They compare what they received with a standard of what they thought they would receive. This has a large effect on how the consumer perceives that company, along with the company's brand and products.
Consumer's decisions in this model can be influenced by a number of factors.
1. Perception: Exposure, Attention, and Interpretation of marketing and critic messages.
2. Learning: Associating similar products, having consequences, receiving bundled stimulus, and observing others.
3. Motivation: Consumers divide needs into categories based on Maslow's hierarchy of needs (survival, safety, belonging, confidence, self-fulfillment). Originally it was thought that a lower level needed to be satisfied before higher levels, but in practice this is not always the case.

Personality traits also affect decisions:
Having the desire to try new things, own products, interact socially, and think about things affect what a consumer buys. Self confidence is also a big personality determinant.
Age, family life cycle, psychographics (grouping people depending on activities, interests, and opinions [AIOs]), arousal, pleasure, time, culture, social class, group think, opinion leaders, sex roles, and product communities all influence a consumer's decisions.
Another determinant is self concept. Self concept is the set of beliefs a person holds about themselves (attributes and abilities). People may have different self concepts at different times depending on what situation they are in and who they are with. This is important because it means that marketing must make sure the correct self concept is active when marketing communications are made.
The ideal self seems to be more influential than the actual self when dealing with social products. When dealing with functional products, actual self seems to take precedence.
This model is indeed more structured that meets the eye, and marketers can use it to their advantage.
1. Problem recognition - This is caused by seeing a difference in reality and ideal. A marketing message can cause a customer to recognize this difference.
2. Information search - Consumers identify solutions based on memories or the external environment. Marketing communicates information about products in hopes of leaving the consumer with good memories of it's product.
3. Evaluation of alternatives - Consumers narrow down solutions based on what they like, as well as what is feasible. Marketing attempts to get consumers to use evaluative criteria that is in their favor.
4. Product choice - Consumers use heuristics to make a final decision. Marketing attempts to communicate which heuristics are important. Examples are price equals quality, brand loyalty, and country of origin matters.
5. Post-purchase evaluation - Consumers decide if the decision they made was a good one. They compare what they received with a standard of what they thought they would receive. This has a large effect on how the consumer perceives that company, along with the company's brand and products.
Consumer's decisions in this model can be influenced by a number of factors.
1. Perception: Exposure, Attention, and Interpretation of marketing and critic messages.
2. Learning: Associating similar products, having consequences, receiving bundled stimulus, and observing others.
3. Motivation: Consumers divide needs into categories based on Maslow's hierarchy of needs (survival, safety, belonging, confidence, self-fulfillment). Originally it was thought that a lower level needed to be satisfied before higher levels, but in practice this is not always the case.
Figure 1 - Maslow's Hierarchy of Needs

Having the desire to try new things, own products, interact socially, and think about things affect what a consumer buys. Self confidence is also a big personality determinant.
Age, family life cycle, psychographics (grouping people depending on activities, interests, and opinions [AIOs]), arousal, pleasure, time, culture, social class, group think, opinion leaders, sex roles, and product communities all influence a consumer's decisions.
Another determinant is self concept. Self concept is the set of beliefs a person holds about themselves (attributes and abilities). People may have different self concepts at different times depending on what situation they are in and who they are with. This is important because it means that marketing must make sure the correct self concept is active when marketing communications are made.
The ideal self seems to be more influential than the actual self when dealing with social products. When dealing with functional products, actual self seems to take precedence.
This model is indeed more structured that meets the eye, and marketers can use it to their advantage.
Research & Observing Consumers
Observing consumers may be the most important part of marketing there is. Without knowing the consumer, as well as their needs and thoughts, it is impossible to provide for them. It won't matter what price is set or how innovative a product is. It won't matter where it can be found or how it's existence is communicated. If a product does not satisfy a need, it won't be purchased.
Market Demand
To get a better idea of profitability when looking at primary and secondary market research data you can observe the rate of adoption that is commonly associated with industry products:

Calculating demand for market potential and sales estimates can be further refined by using one of the following example methods:
1 - total market demand = number of buyers X quantity purchased b average buyer per year X price of average unit
2 - total number of households in target region X those who can use it X those who can purchase it X etc.
Market Research
Primary data - information gathered for a specific purpose
Secondary data - information previously collected for another purpose
Both primary and secondary data must be relevant, current, accurate, and impartial.
This data can be gathered via numerous methods, most of which are obvious:
observation
survey
experiment
mail telephone
personal
online
sampling group, size, procedure (random, random from split up groups, convenience, judgment, quota)
questionnaire
instruments
There are several ways to observe consumers and collect their thoughts. Interviews, focus groups, surveys, previously created documentation, and simply watching them are the main ways. Each of these methods will work to a degree, but it is usually a time and cost constraint on the observer that limits which methods will be used and to what degree they can be used.
Interviews are usually the best observation method, but also have the highest cost. Surveys are one of the easiest and lowest cost methods, but also one of the least effective. This is because the effectiveness of gaining consumer insights is usually proportional to the relationship that exists between the consumer and the observer. Observers and consumers with stronger relationships tend to have discussions where more is disclosed. More disclosure equates to more completeness. The more experienced the observer is, the less formal and structured the set of questions will be. Usually, it’s considered good practice to ask very open ended questions, funneling down to specific questions only when more detail or clarification is needed. It’s also important to not force the ordering of questions because this invites agendas and can be sensed.
The observer’s job is primarily to listen, but also to record non verbal communication. All verbal communication should be taken care of by an audio recording or video recording if necessary. After the observing process is done, the observer should record their feelings and views. The purpose of consumer observation and interviewing is to generate ideas, check assumptions, form a thesis, find information, and seek opinions. By combining both what is conveyed by those being observed as well as the observer, a more complete picture can be painted.
A few more details about interviews and observing : Watch your own reactions and voice inflections to avoid biasing the interview. Interview 10-15 people; focus groups should be 4-5 for small groups or 6-12 for larger groups. Avoid asking why questions. Address terms of confidentiality and make sure that all the interviewer’s questions are answered. Use an interview discussion guide (IDG). An IDG helps organize topics and provides a funnel mechanism to make sure the interviewer is aware of what general questions should be asked, what specific questions are possible, and what transitions should be used.

As long as you have a good sample size and your sample reflects the needed demographic, following the observation guidelines expressed above will allow you to gain insights that are not only impressive and important, but ones that are correct as well.
Market Demand
To get a better idea of profitability when looking at primary and secondary market research data you can observe the rate of adoption that is commonly associated with industry products:

Calculating demand for market potential and sales estimates can be further refined by using one of the following example methods:
1 - total market demand = number of buyers X quantity purchased b average buyer per year X price of average unit
2 - total number of households in target region X those who can use it X those who can purchase it X etc.
Market Research
Primary data - information gathered for a specific purpose
Secondary data - information previously collected for another purpose
Both primary and secondary data must be relevant, current, accurate, and impartial.
This data can be gathered via numerous methods, most of which are obvious:
observation
survey
experiment
mail telephone
personal
online
sampling group, size, procedure (random, random from split up groups, convenience, judgment, quota)
questionnaire
instruments
There are several ways to observe consumers and collect their thoughts. Interviews, focus groups, surveys, previously created documentation, and simply watching them are the main ways. Each of these methods will work to a degree, but it is usually a time and cost constraint on the observer that limits which methods will be used and to what degree they can be used.
Interviews are usually the best observation method, but also have the highest cost. Surveys are one of the easiest and lowest cost methods, but also one of the least effective. This is because the effectiveness of gaining consumer insights is usually proportional to the relationship that exists between the consumer and the observer. Observers and consumers with stronger relationships tend to have discussions where more is disclosed. More disclosure equates to more completeness. The more experienced the observer is, the less formal and structured the set of questions will be. Usually, it’s considered good practice to ask very open ended questions, funneling down to specific questions only when more detail or clarification is needed. It’s also important to not force the ordering of questions because this invites agendas and can be sensed.
The observer’s job is primarily to listen, but also to record non verbal communication. All verbal communication should be taken care of by an audio recording or video recording if necessary. After the observing process is done, the observer should record their feelings and views. The purpose of consumer observation and interviewing is to generate ideas, check assumptions, form a thesis, find information, and seek opinions. By combining both what is conveyed by those being observed as well as the observer, a more complete picture can be painted.
A few more details about interviews and observing : Watch your own reactions and voice inflections to avoid biasing the interview. Interview 10-15 people; focus groups should be 4-5 for small groups or 6-12 for larger groups. Avoid asking why questions. Address terms of confidentiality and make sure that all the interviewer’s questions are answered. Use an interview discussion guide (IDG). An IDG helps organize topics and provides a funnel mechanism to make sure the interviewer is aware of what general questions should be asked, what specific questions are possible, and what transitions should be used.
Example IDG

As long as you have a good sample size and your sample reflects the needed demographic, following the observation guidelines expressed above will allow you to gain insights that are not only impressive and important, but ones that are correct as well.
The Numbers in a Business Trend 22 June, 2010
Statistics is a subject taught, and usually required in business schools. What’s the reason? It helps us see not only the trends in Business, but what parts of those trends are statistically significant. Regression analysis lets us see what matters in determining costs and prices, and is usually run in conjunction with historical data. In order to explain regression analysis, we need to define a few things:
Median: The middle value in an ordered set of numbers that separates the lower half from the higher half.
Mean: The numeric average of a set of numbers.
Mode: The numeric value in a set of numbers that occurs most frequently.
Variance: The dispersion of numbers in a set around the mean.
Standard Deviation: The variance of a set of numbers whose unit of measurement is the same as those of the number set.
CV (Coefficient of Variation): A ratio of standard deviation to the mean.
R2 (Coefficient of Determination): The ratio of explained variance to total variance.
Standard Error: A measure of fluctuation from one sample statistic to another.
Normal Distribution (standard normal): A bell curved graph used to describe number sets with complete data or a high sample size.
Student’s Distribution (t-distribution): A bell curved graph used to describe number sets when the sample size is small.
Manual Regression: Using a number set to generate a line equation that resembles the trend of the data.
T-Score: An indication of correctness of a hypothesis. This is sometimes called the t-stat.
P-Value: A value that shows the significance of a factor.
Degrees of Freedom: The variability in the curve of a statistic. Generally this equals n-(k+1) where n is the sample size and k is the number of independent variables.
T-Table: A lookup table where one axis represents degrees of freedom and the other axis represents the probability. A T-Score is found where the correct column and row intersect.

Hypothesis Testing: First, you must choose both a hypothesis and an inverse of the hypothesis, such that you can prove one of them by choosing the correct probability when using the T-Table. A null hypothesis (the opposite of what you want to prove) and an alternative hypothesis (what you want to prove) are chosen as equality equations. The equality of the null and alternative hypotheses determines what kind of tail test to use in the lookup table. If the equality symbol used in the alternative hypothesis is a '>', it is a right tailed test. If it is a '<', you have a left-tailed test. If it is neither, you have a two-tailed test. A null hypothesis is generally used for the test because of historical significance in the philosophy of math as well as the innocent until proven guilty axiom.
The following example deals with salaries. If a study claims that programmers make $100,000/year, but you think they make more, H1(The alternative hypothesis) is x > 100,000. The null hypothesis would then be H0(the notation for a null hypothesis): x <= 100,000. The alternative and null hypothesizes are always compliments (opposites) of each other, and the alternative hypothesis (what you are trying to prove) should be stated first.
After comparing data sets using the equations that follow, and comparing the t-stat to the critical value found in the T-Table lookup, we'll have enough information to determine what is correct. Using the standard deviation, t-score, and our data set, we have enough data to make a conclusion.
The significance of the right, left, or two tailed choice is that anything that falls respectively to the right, left or both of the critical regions denoted by the T-Table lookup number equates to rejecting H0, and accepting H1.
Equations:

That's the theory. Most people will simply use Excel or some other program to run all the calculations automatically. However, understanding what is going on, and how to correctly interpret what Excel tells you is much easier if you understand that theory.
Using Excel’s Data Analysis package, you can select columns to include in a regression, at which point you’ll get a nice little table like the following:

So, what does this mean? Well, the point of a regression analysis is to create a fitted line to the scattered data points that we have. The key here is that we want to find a relationship between x (the numbers that drive our end result) and y (our end result) in our plots. The bottom line is: the more significant the variables are, the bigger the slope of the line will be. This also means that the if the relationship is small, the slope of the line will be small. We could say that the closer to 0 the slope is, the less significant that slope is. Because we are trying to prove that something is significant and that the slope is not 0, we can use the following hypothesis. H0: x =0, H1: x!=0, where x is the slope of the regression line. We can take our t-statistic (t) equation from above and see if the slope is statistically significant.
Let's use an example that uses Excel's linear regression to preform a hypothesis test. Using a setup as shown in the screenshot above, Excel gives us a t-stat. We must now use a t-table (google it if you don't have a complete one) to compare the t-stat given by excel to what probability we want. Usually 95% is the standard probability used. Our df (degrees of freedom) is 3. We get this from using the df definition given above, and the data from the screenshot (showing an example of material cost effect on overall cost) : n-(k+1) -> 8-(4+1) -> 3. The T-Table score is 2.353. Excel says our t-stat is .62 for materials. Because .62 is not > 2.353, we do not reject H0, and conclude that the material cost is not significant in the overall cost!
A couple of important notes now that we have seen how hypothesis testing works:- Rejection does not mean something is false, it means that it is not reasonable.
- Accepting does not mean something is true, it means it is reasonable.
- Some people use a p-value rule: Reject H0 if p <>
- Don't just believe the output. Always make sure the numbers make sense.
Presenting on strategy or strategically presenting? 04 May, 2010
Here's a few things I've learned in the last week on presenting.
The executive summary.
Always prepare and provide an audience with an executive summary of what you are going to present. Executive summaries are not just for executives. They are meant to keep the attention of the audience as well as help them get back on track if they get lost. They should be about 10% as long as either your presentation, or your research document. They help, and there is no real downside to having them. Many times it even helps to informally tell attendees about your findings. This can lower the wow factor of a presentation, but it can also make sure you didn't miss a critical piece of information.
Be open, but don't apologize.
If you've put in the time and effort required to make a presentation worth listening to, then you should assume that your information is at least as good as what anyone else has. You should be the immediate authority on the subject. Focus on facts and avoid words like could, might, and possibly. If there is something you missed, thank those who brought up the point. If the missed information is not critical to your point, move on.
Clutter is bad.
Having a large sum of information and facts to back up a point can be great if it's in the right place. A summary and presentation of a point should be just that. State the most important aspects of what it is and why it matters, then move on. If you do have a slide in a presentation that has a few parts to it, make sure you list out the parts. You don't want a long list, but if you don't have any list and start rambling off several items that are not written anywhere that the audience can see, they'll get lost.
References.
Detailed references are great, if they're in the right place. Make sure you have everything documented, but when presenting, don't make the references your focus. Your focus should be the content of the facts and the 'so what?' factor. Try using phrases such as 'research shows.' If someone does ask for proof or where you found the information, then bring up more detailed references.
The fix.
If you present problems, or identify areas where improvement is needed, you need to specify a plan of action for resolving them.
Talking and transitions.
Unless you are pointing out specific things in a visual aid, you should be looking at your audience. You also need to make sure that when addressing those listening, that there is a common thread throughout your presentation and transitions are included. Relating ideas to each other as well as to the audience will help the audience stay interested.
These aren't items from lists that I've come across. This is the feedback that I received after presenting a school project to executives.
Got strategy? 27 April, 2010
Well, do you? I suppose the harder question is defining what strategy actually is. Once that's done, answering the question "Got strategy?" will probably be equivalent to answering the question "Are you prepared for how long you want to last?" Many people think it's just a synonym for planning. Some think it is the way you do something, and others have no idea. There are a few definitions of strategy. All are correct, but each offers its own perspective:
Before I go further, I should address some things to avoid when thinking about strategy. You can't predict the future, you can't detach planning and implementation, you can't be too formalized, and you must finish a strategy before it becomes obsolete.
There are strong advocates (Mintzberg) of informal emergent strategy who let it flow more than they guide it, and there are more formal methods like Porter's generic strategies. Although many successful strategies have emerged without much planning, having a concrete plan will help find holes as well as ensure actual implementation.
Strategy can be broken down into four distinct levels (Corporate, Global, Business, and Functional). The following describes the details of each.
 It prompts questions like:
Definitions
- How you compete
- Using and improving your competitive advantage
- A single, detailed plan that's based off of a company's goals and competitive advantages
Before I go further, I should address some things to avoid when thinking about strategy. You can't predict the future, you can't detach planning and implementation, you can't be too formalized, and you must finish a strategy before it becomes obsolete.
There are strong advocates (Mintzberg) of informal emergent strategy who let it flow more than they guide it, and there are more formal methods like Porter's generic strategies. Although many successful strategies have emerged without much planning, having a concrete plan will help find holes as well as ensure actual implementation.
Strategy can be broken down into four distinct levels (Corporate, Global, Business, and Functional). The following describes the details of each.
Corporate Strategy
- Answers the question "What value should be created in what industry?"
- This can include the acquisition or divestment of other companies.
Global Strategy
- Shows how to gain advantages over/with competition by competing internationally.
- Helps identify strengths and weaknesses of international competition.
Diamond of National Advantage
 It prompts questions like:
- Are suppliers global?
- What are demand differences in different countries?
- Can capabilities and resources be developed and used more effectively in other countries?
- How does a specific international culture affect competition?
Business Strategy
This is the business model. A business model answers the following questions:- What does a customer want?
- Who is the customer?
- How are the wants satisfied?
- Razor and razor blades (cheap upfront costs, higher upkeep costs)
- Franchise
- Direct sales (no fixed locations, market directly to customers)
- MLM (multi-level marketing)
- Service model
- Subscription model
- Loyalty based business (iteratively better deals, or continuous improvements)
Functional Strategy
This is all about efficiency. By efficiency, I mean the ratio of required inputs to desired outputs. Some major areas where levels of efficiency can exist are:- Economies of scale
- Learning in the organization
- Project selection
- Processes
Feedback
Finally, it is extremely important to acquire feedback from all strategic levels, and send it back to the top. This is how missions, visions, values, and goals can be refined and become even better inputs to new corporate, global, business, and functional strategy.
Analyzing Environmental Information
Facts and information are necessary resources when making decisions and setting a direction. How does one acquire the facts? A common thread is to look at both external and internal environments. Interestingly enough, even though external factors seem like they would be much more expansive, I believe they can be summarized without too much trouble.
Internal analysis identifies distinctive competencies that an organization has. Distinct competencies are broken up into two categories:
These competency types determine:
The resulting internal analysis helps determine whether an organization should adapt to the external environment, or change the external environment. There are Macro and Micro external environments. The macro environment is comprised of social, legal, environmental, political, and technological factors. This is known as a SLEPT analysis, although other acronyms like PEST, PESTEL, STEEPEL, and others exist. Picking one of these acronyms is usually sufficient because as it is, an issue could fit into more than one bucket (eg. social and environmental). The important thing is not what buckets you use or where the items go; It's that you see all the items.

The micro environment is comprised of a framework coined by Michael Porter from the Harvard School of Business. It's called Porter's 5 Forces. Porter believes that the micro external environment is driven by a small number of critical determinants which he refers to as forces. These forces include the threat of new entrants, current rivals, the power of suppliers, the power of buyers, and the threat of substitutes. Many people have added to this list government policy and compliment products.

I think the definitions and short descriptions given of macro and micro analysis are sufficient to get started with the collection of facts.

The internal environment however, is a little more complex and harder to explain. There are several methods that include a resource based view, functional based view, building blocks of competitive advantage, value chain, and Hamel and Prahalad's competency matrix. All of these except two are different.
These are not the only methods. Other ways to evaluate environments include looking at the industry's maturity in its life cycle and growth curves for a type of product. Given a reasonably finite amount of time however, only certain evaluation techniques can be used to make decisions and plan. If too much time is taken, opportunities will pass by and threats will overwhelm. Let us now look at these evaluation techniques in detail.
The value chain's purpose is to analyze how hand-offs between functions or resources are handled and what interactions take place between them. Specifically, the value chain's purpose is to make sure each hand-off actually adds some sort of value to the overall process.

The resource based view and functional based view has you list out either all the resources or all the functions and state whether each are valuable, rare, imitable, or fit the organization (VRIO).
The building blocks of competitive advantage method has you state whether efficiency, quality, innovation, and response to customers fits in a low-cost, differentiation, niche low-cost, niche differentiation, or hybrid (best value) category. This is based on Porter's generic strategies. The generic strategies introduced by Porter attempt to identify a few main areas in which a company can decide to compete in how they positions products and services to the customer.

The building blocks method helps identify which of Porter's generic strategies an organization is currently aligned with by looking at several concrete operational areas (Efficiency, Quality, Customer Responsiveness, and Innovation).
So, as you can see, even though the external environment may be much larger than the internal, the internal seems to be more complex to analyze. I believe this is because most of the time you can only watch the external environment, while you have the opportunity to drastically change the internal environment.
That is how you get the facts. We still however, must turn to making those facts useful. This takes the form of two popular frameworks: SWOT and scanning.
SWOT(Strengths, Weaknesses, Opportunities, Threats) looks at the external facts to determine threats and opportunities. It then looks at internal facts to identify strengths and weaknesses. You then have several options for the four lists you just made. You can compare strengths to weaknesses and opportunities, weaknesses to opportunities and threats, etc. One option is to match strengths to opportunities so you know what you should emphasize. Another option is converting weaknesses and threats into strengths and opportunities, but this usually means you're focusing on playing catchup to the competition. Creating a SWOT is really where you begin to see some lines created as to what should be focused on, and what should be filed away for later.
Scanning is simpler and less formal. It involves finding and ranking opportunistic areas by asking, surveying, and creating hypotheses. You then work backwards, finding proof to back up your ideas.
Once areas that require focus have been identified, either creating an in-depth implementation plan, or using scenario analysis (evaluating multiple alternatives) are the next steps. This is where the best strategy is discovered and its implementation becomes the focus.
These ways of getting the facts have evolved from faculty, textbooks, trends, and experience. They're really the best way to do it.
Internal analysis identifies distinctive competencies that an organization has. Distinct competencies are broken up into two categories:
- Capabilities
- Resources & the ability to use them
These competency types determine:
- The value a customer is getting
- The price the customer will pay
- The price of the value creation
The resulting internal analysis helps determine whether an organization should adapt to the external environment, or change the external environment. There are Macro and Micro external environments. The macro environment is comprised of social, legal, environmental, political, and technological factors. This is known as a SLEPT analysis, although other acronyms like PEST, PESTEL, STEEPEL, and others exist. Picking one of these acronyms is usually sufficient because as it is, an issue could fit into more than one bucket (eg. social and environmental). The important thing is not what buckets you use or where the items go; It's that you see all the items.
A SLEPT Example
The micro environment is comprised of a framework coined by Michael Porter from the Harvard School of Business. It's called Porter's 5 Forces. Porter believes that the micro external environment is driven by a small number of critical determinants which he refers to as forces. These forces include the threat of new entrants, current rivals, the power of suppliers, the power of buyers, and the threat of substitutes. Many people have added to this list government policy and compliment products.
Porter's 5 (sometimes 6) Forces

I think the definitions and short descriptions given of macro and micro analysis are sufficient to get started with the collection of facts.
A Porter's Forces Example
The internal environment however, is a little more complex and harder to explain. There are several methods that include a resource based view, functional based view, building blocks of competitive advantage, value chain, and Hamel and Prahalad's competency matrix. All of these except two are different.
These are not the only methods. Other ways to evaluate environments include looking at the industry's maturity in its life cycle and growth curves for a type of product. Given a reasonably finite amount of time however, only certain evaluation techniques can be used to make decisions and plan. If too much time is taken, opportunities will pass by and threats will overwhelm. Let us now look at these evaluation techniques in detail.
The value chain's purpose is to analyze how hand-offs between functions or resources are handled and what interactions take place between them. Specifically, the value chain's purpose is to make sure each hand-off actually adds some sort of value to the overall process.
The Value Chain
H&P's Matrix is really just four quadrants with one axis being old to new markets, and the other axis being old to new products. It is meant to determine what kind of innovation is taking place.
The H&P Competency Matrix
The H&P Competency Matrix
The resource based view and functional based view has you list out either all the resources or all the functions and state whether each are valuable, rare, imitable, or fit the organization (VRIO).
The Resource Based View (RBV)

The Functional View 
The building blocks of competitive advantage method has you state whether efficiency, quality, innovation, and response to customers fits in a low-cost, differentiation, niche low-cost, niche differentiation, or hybrid (best value) category. This is based on Porter's generic strategies. The generic strategies introduced by Porter attempt to identify a few main areas in which a company can decide to compete in how they positions products and services to the customer.
Porter's Generic Strategies

The building blocks method helps identify which of Porter's generic strategies an organization is currently aligned with by looking at several concrete operational areas (Efficiency, Quality, Customer Responsiveness, and Innovation).
The Building Blocks View 
So, as you can see, even though the external environment may be much larger than the internal, the internal seems to be more complex to analyze. I believe this is because most of the time you can only watch the external environment, while you have the opportunity to drastically change the internal environment.
That is how you get the facts. We still however, must turn to making those facts useful. This takes the form of two popular frameworks: SWOT and scanning.
SWOT(Strengths, Weaknesses, Opportunities, Threats) looks at the external facts to determine threats and opportunities. It then looks at internal facts to identify strengths and weaknesses. You then have several options for the four lists you just made. You can compare strengths to weaknesses and opportunities, weaknesses to opportunities and threats, etc. One option is to match strengths to opportunities so you know what you should emphasize. Another option is converting weaknesses and threats into strengths and opportunities, but this usually means you're focusing on playing catchup to the competition. Creating a SWOT is really where you begin to see some lines created as to what should be focused on, and what should be filed away for later.
Scanning is simpler and less formal. It involves finding and ranking opportunistic areas by asking, surveying, and creating hypotheses. You then work backwards, finding proof to back up your ideas.
Once areas that require focus have been identified, either creating an in-depth implementation plan, or using scenario analysis (evaluating multiple alternatives) are the next steps. This is where the best strategy is discovered and its implementation becomes the focus.
These ways of getting the facts have evolved from faculty, textbooks, trends, and experience. They're really the best way to do it.
Ethics & Corporate Social Responsibility 22 April, 2010
So, what exactly does it mean to be ethical? Shouldn't the answer be easy? Many people assume that knowing what is right is the easy part, and it's the implementation that comes at a higher cost. Obeying the law is pretty obvious. I'm going to say that agreeing on what is right is the difficult task. Everyone has their own definition of right and wrong and people can put everything into these categories. The problem exists because everything they put in the 'right' category is what they believe to be ethical, and although there may be a universal standard, not everyone accepts it. Honesty and integrity are fairly standard, but creativeness is something that can walk a fine line.
So what does this mean for a business? Here are my thoughts. The purpose of business is to cater to society's wants. But what is a business without uniqueness? A business generally has a mission and set of values that set them apart, even if they aren't explicit. These values denote the moral obligations that it has, and the values should act as helps to make decisions when no explicit policy exists. Now, there are some responsibilities that happen as a side effect of running the business like sustainability, licenses to operate, and reputation, but these are usually just side effects. The moral obligations derived from a company's values are the only things the company will still pursue in difficult times. However, Peter Drucker has said that it is irresponsible to promote a noble motive that is beyond what is economically feasible for a company. Martyrdom can only happen once, and it is often better to steadily create value for society than to make one single and final attempt at perfect ideology.
There are right vs. right decisions where there are two competing ethical needs, but choosing one forces you to ignore the other. Les Miserables is a case in point. Another example is differences in bribes. Is bribing to sway decisions for personal gain any different than bribing to sway decisions to be what they ethically should be?
I suggest that making sure ethics are addressed on all issues (a go/no-go analysis for a project for example) can remind everyone that it does matter. People would be prepared to make the correct decision if a gray area alternative ever arose.
Although profit is thought to be the major motivation for organizational action, the value provided to customers is a far better indicator of future success and profits. This value to customers should not include corporate social responsibility (CSR) if its costs are high and the CSR does not directly apply to the industry or area of expertise for the company. Usually it is best to CSR that is within a company's competency domain. In the end, this is actually beneficial to a company because it keeps them from having to scramble later on should regulations be put in place to force the behavior.
Bowen, Carrol, et. al may have said it best: A company should act like a good citizen.
Balancing the Equation 17 March, 2010
A philosophical introduction to embarking on a journey through B-School (my forward if you will):
What does it mean to be great? It could mean being the best at something, or being in the top nth percentile. It could have reference to being able to swiftly complete tasks in an area not well known to many. It could be physical, mental, or intellectual.
I've heard it over and over from executives and people who have had to give something of their selves to get where they are, that people at the top have either given up a lot to get there, or will have to give up a lot soon. Even Michael Porter, a highly influential professor from Harvard Business School teaches the idea that growth comes with trade-offs. There is a theoretical maximum amount of work that can be done by an entity. When this maximum is achieved, the only way to get more is to give up something else.
There has always been a thought in my mind that anyone can be great in whatever they want, as long as they are willing to accept the possibility of needing to give everything else up. But what if it is deeper than this. What if the sacrifice needed to attain something must be as great as what is being aimed for? I think that people are able to be great because they give up great things.
Everyone has infinite potential, and to the extent that you give up that infinite potential, you can accomplish anything. Social life, family, religion, wants, and emotions play into this and decide what that number one priority is.
What is the one thing that you value the most? What would you never give up? Is this the same as what your number one priority is? It it the same as what you are striving to be the best at?
I'll leave you to answer those questions. In the mean time, my interim priority is to learn about the business world. I don't have everything figured out yet, but for now an MBA is my means to being able to teach and make decisions and prepare for the unknown future. We'll see where it leads me.
Subscribe to:
Posts (Atom)