
Everyone knows that finance and accounting deals with money. What they don't know is that these two subjects are not black and white. Assuming ethical behavior is taking place, there are three factors that make the numbers not so obvious, predictable, or in other words, black and white.
First, the interpretation of many measurements can vary because there is not a globally accepted way to calculate everything. Not only are there different accounting standards from country to country, the best way to calculate many financial ratios differs depending on who you talk to. There are also different algorithms to calculate items such as depreciation and inventory attributes. Knowing the general theory behind many financial ratios can lead to a more correct interpretation.
Second, assumptions are used to predict elements that are unknown. These assumptions are best guesses by individuals that themselves may not have all relevant information. Aside from discussions or critical thinking, assumptions can also come from a probability analysis based on best and worst case outcomes. A common simulation used to create these assumptions is the Monte Carlo method.
Third, the availability of inside information may not be widely known, but may contribute significantly to changes in the numbers. This factor can be hedged by having an understanding of annual and quarterly reports. One of the most important parts of annual and quarterly reports, besides the actual financial statements, is the Management Discussion and Analysis (MD&A). Management is required to divulge any important risks, benefits, or other factors that could affect the current state of the company or any official projections that have been made.

Show Me the (Real) Money
There are several things that everyone should know about a company in terms of its finances. The most important aspect of a company's finances is usually all about valuation.
Many people think of stock price as the major financial indicator for how a company is doing at the minute. In reality, stock price is a supply and demand for a share of a company that represents all future profits and growth. It's valuation.
Valuation has many facets which include relative comparisons to industry averages. It also includes cash flow, sustainable growth (internal and external), and general ratio analysis. Although there are macro economic factors like substitute products that can affect a company's value, most of the elements that a company can control are embedded in their financial statements.
Financial statements are required for publicly held companies and usually take the form of 10-Q and 10-K filings. There are other filings for non US-based companies, but they are very similar to the 10-Q/K statements. While there are also 8-K statements that show important changes and announcements a company is making, 10-Q/K statements show the major financial statements and other important information about the company. The 10-Q/K statements are created on a quarterly (Q) and annual (K) basis.
The major financial statements included in 10-Q/K filings are the Income Statement (Profit and Loss or P&L), the Balance Sheet (Statement of Financial Position), and the Statement of Cash Flows. Each of these statements has its own purpose, but interacts heavily with the others.
For each statement, there is a general accounting equation that describes the content:
Example Balance Sheet

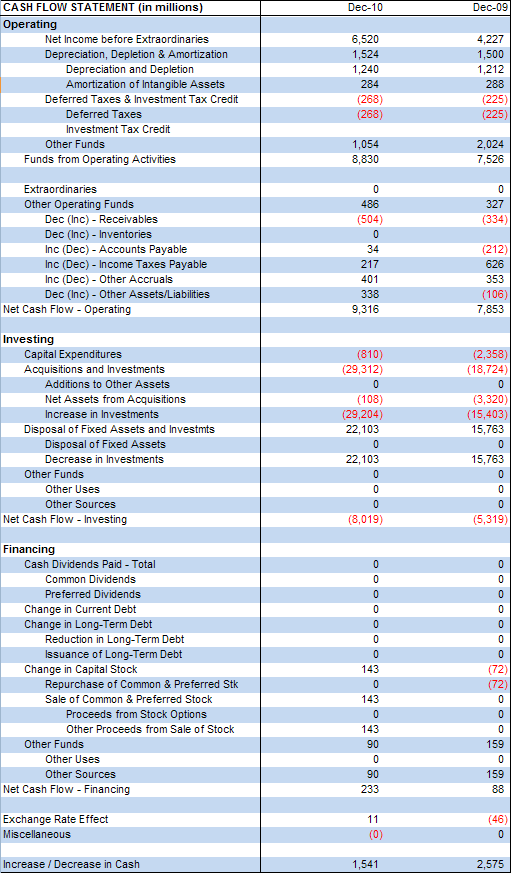
Example Cash Flow Statement


There are many more ratios, but these are used quite a bit. There are expansions on ratios such as P/E -> PEG. One additional expansion ratio not previously mentioned that does carry some fame is the DuPont expansion of ROE. Its purpose is to give a better idea of what contributes to ROE by showing that ROE can be expanded to three separate other ratios if identical numerator/denominator pairs are not canceled out:

It is important to note that while the theory of each financial ratio is generally the same, they are sometimes calculated differently and must be compared only to other ratios that have been calculated in the same manner.

Again, it is important to stress that when making numeric comparisons, things are calculated in the same way. Use the numbers, management comments, and any other information you have, but remember that you will ultimately be making decisions based on this information and you must both understand it and take it with a grain of salt. Everyone ends up having their own interpretation.
Many people think of stock price as the major financial indicator for how a company is doing at the minute. In reality, stock price is a supply and demand for a share of a company that represents all future profits and growth. It's valuation.
Valuation has many facets which include relative comparisons to industry averages. It also includes cash flow, sustainable growth (internal and external), and general ratio analysis. Although there are macro economic factors like substitute products that can affect a company's value, most of the elements that a company can control are embedded in their financial statements.
Financial statements are required for publicly held companies and usually take the form of 10-Q and 10-K filings. There are other filings for non US-based companies, but they are very similar to the 10-Q/K statements. While there are also 8-K statements that show important changes and announcements a company is making, 10-Q/K statements show the major financial statements and other important information about the company. The 10-Q/K statements are created on a quarterly (Q) and annual (K) basis.
The major financial statements included in 10-Q/K filings are the Income Statement (Profit and Loss or P&L), the Balance Sheet (Statement of Financial Position), and the Statement of Cash Flows. Each of these statements has its own purpose, but interacts heavily with the others.
For each statement, there is a general accounting equation that describes the content:
- Income Statement: Revenues - Expenses = Profit/Loss
- Balance Sheet: Assets = Liabilities + Shareholder's Equity
- Statement of Cash Flows: Operating Cash + Investing Cash + Financing Cash + Beginning Cash = Ending Cash
Example Income Statement

Example Balance Sheet

Example Cash Flow Statement
Financial Ratios are created from line items of the three financial statements previously mentioned. They can be grouped into six categories:
Liquidity
Ratio calculation- Current Ratio
- Quick Ratio
- Debt to Equity Ratio
- Receivables Turnover
- Fixed Asset Turnover
- Total Asset Turnover
- Days of Sales Outstanding (DSO)
- Debt Ratio
- Times Interest Earned (T.I.E.) Ratio
- Fixed Charge Coverage Ratio
- Net Profit Margin
- Return on Assets (ROA)
- Return on Equity (ROE)
- Price to Earnings (P/E) Ratio
- Cash Flow per Share Ratio
- Book Value per Share Ratio
- Market to Book Ratio
- Economic Value Added (EVA)
- Market Value Added (MVA)
- Internal Growth Rate (IGR)
- Sustainable Growth Rate (SGR)
- Price-to-Earnings to Growth (PEG) Ratio

There are many more ratios, but these are used quite a bit. There are expansions on ratios such as P/E -> PEG. One additional expansion ratio not previously mentioned that does carry some fame is the DuPont expansion of ROE. Its purpose is to give a better idea of what contributes to ROE by showing that ROE can be expanded to three separate other ratios if identical numerator/denominator pairs are not canceled out:

It is important to note that while the theory of each financial ratio is generally the same, they are sometimes calculated differently and must be compared only to other ratios that have been calculated in the same manner.
A company comparison using ratios

Again, it is important to stress that when making numeric comparisons, things are calculated in the same way. Use the numbers, management comments, and any other information you have, but remember that you will ultimately be making decisions based on this information and you must both understand it and take it with a grain of salt. Everyone ends up having their own interpretation.
Strategy Performance Part II 09 December, 2010
Even though most people are concerned about their own health, I'm guessing that a small percentage of those people don't really think about the health of the company they work for. I would argue that although many employees are constantly searching for that next innovation, simple process improvement would improve the average company just as much.
Process improvement is not only about improving, it's also about knowing what is possible. A process is working well if it consistently performs well, and has a low level of daily variance. When looking at a company checkup in terms of its process health, the investment in improvement is not as expensive as first impressions may indicate. In fact, many studies show that it is not the willingness or ability to improve, but the time required that is often the problem.
Four main goals of process improvement are:
Two popular ways of improving processes are benchmarking and waste identification. Either way, it's all about removing things that do not add value and adding more value where it is needed.
Benchmarking is all about using metrics to grade a process. These grades can then be compared to either other internal benchmark grades or external benchmark grades dealing with similar processes. Internal comparisons are used for continuous improvement from where the company was previously at. External comparisons are used to find out how well a process compares to the best versions of those processes on a local, national, or even global scale.
Benchmarking and process improvement is comprised of the following steps:

Cause and Effect diagrams are useful for finding root causes to problems. Looking at the following diagram, you can see why some people call it a fishbone diagram. Every time there is a reason for the effect, an attempt is made to find a lower level cause.

Pareto charts are cross plots of specific problem types vs total problems (relative vs. absolute). They are useful in showing which problem areas should be addressed first.
If it is uncertain whether a process needs to be benchmarked or improved, try looking at that process from a customer's perspective and see if you would be impressed or left wanting.
Process improvement is not only about improving, it's also about knowing what is possible. A process is working well if it consistently performs well, and has a low level of daily variance. When looking at a company checkup in terms of its process health, the investment in improvement is not as expensive as first impressions may indicate. In fact, many studies show that it is not the willingness or ability to improve, but the time required that is often the problem.
Four main goals of process improvement are:
- Cutting costs
- Cutting waste
- Improving quality
- Removing stress
Two popular ways of improving processes are benchmarking and waste identification. Either way, it's all about removing things that do not add value and adding more value where it is needed.
Benchmarking is all about using metrics to grade a process. These grades can then be compared to either other internal benchmark grades or external benchmark grades dealing with similar processes. Internal comparisons are used for continuous improvement from where the company was previously at. External comparisons are used to find out how well a process compares to the best versions of those processes on a local, national, or even global scale.
Benchmarking and process improvement is comprised of the following steps:
- Talk to those dealing with the process (to gain information and buy-in)
- Create metrics for comparing improvement levels
- Collect metrics before a change (as the process exists today)
- Make the change
- Collect metrics after a change
- Make sure the improvements and measurements are statistically significant
- Present findings, real world benefits, and recommendations
- Officially incorporate the changes into the process
- When needed, benchmark again for continued improvement
- Time
- Number of people involved
- Number of manual steps
- Number of communication methods or problems
- Amount of redundancy
- Transportation (moving things more than needed)
- Inventory (any unneeded storage or depreciation)
- Motion (people moving more than needed)
- Waiting
- Over production (making more than needed)
- Over processing (poor tool use)
- Defects (taking extra time to find defects and fix them)
- Underutilized resources
- Process Diagrams & Value Stream Mapping
- Cause and Effect (also known as either Fishbone or Ishikawa diagrams)
- Pareto Charts / Analysis

Cause and Effect diagrams are useful for finding root causes to problems. Looking at the following diagram, you can see why some people call it a fishbone diagram. Every time there is a reason for the effect, an attempt is made to find a lower level cause.

Pareto charts are cross plots of specific problem types vs total problems (relative vs. absolute). They are useful in showing which problem areas should be addressed first.

If it is uncertain whether a process needs to be benchmarked or improved, try looking at that process from a customer's perspective and see if you would be impressed or left wanting.
Strategy Performance 07 December, 2010
After strategies have been created and a direction has been set, a company must perform well to see the desired results. One popular way to measure strategy performance is by using a Balanced Scorecard (BSC).
The BSC was popularized by Robert Kaplan and David Nortan in 1992. It is similar to a dashboard, but with a focus on company and consumer trade-offs. Stress is placed on an informing purpose rather than a controlling one. It can be thought of as a way to measure strategy because it links a company's actions to its mission and vision.
Balanced Scorecards are created based on four quadrants:
Each of these quadrants are further broken down into:
Goals should be specific, but cover many parts of each quadrant such as:

There are many benefits to the BSC which include:
The BSC was popularized by Robert Kaplan and David Nortan in 1992. It is similar to a dashboard, but with a focus on company and consumer trade-offs. Stress is placed on an informing purpose rather than a controlling one. It can be thought of as a way to measure strategy because it links a company's actions to its mission and vision.
Balanced Scorecards are created based on four quadrants:
- Internal Processes (how efficient are you at satisfying customers?)
- Customers (how do customers see you?)
- Finances (how do shareholders see you?)
- Internal Learning and Innovation (how can you create more value?)
Each of these quadrants are further broken down into:
- Goals
- Measurements
Goals should be specific, but cover many parts of each quadrant such as:
- Short/Long Term
- Financial/Non-Financial
- Leading/Lagging Indicators
- Internal/External Indicators
The following flow shows how the BSC connects strategy to action.

There are many benefits to the BSC which include:
- Showing the impact one change has on other quadrants
- The ability to measure intangible assets
- People are pulled towards the company mission and vision
- Areas that seem disjoint, but are linked, are identified
- Everyone in the company is involved
- Cause and effect relationships between BSC goals and outcomes are identified
- It shows which changes are reflected in the bottom line
- Goals should always be linked to the strategy
- Cause and effect relationships between goals and outcomes should be validated
- Measurements must be valid and statistically significant
- The goals should be communicated throughout the entire company
- Time should be taken to understand how quadrants and quadrant goals are related
Outlining the Marketing Plan 26 August, 2010
Here's an outline for a marketing plan.
Some parts will be longer, others may only be a sentence or even be non-existent.
It's better to avoid 'I', 'we', and 'you', but if you find yourself frustrated or stumbling on these aspects, drop them in favor of smoothness. The meat of the plan and the part that will be of interest to most people will be that of section 'I', which may be the majority of the summary in section 'A'. The rest of the plan is backing, justification, and proof that section 'I' will succeed. Section 'I' explains the actual product, as well as the major assumptions.
A - Executive Summary
1 - State the product, it’s name, the company name, and who your market is
2 - Give a brief overview of the whole plan
a - Summarize assessments
b - Summarize goals
c - Summarize recommendations
B - Introduction
C - Customer Analysis
1 - Customer identification/definition
2 - Customer demographics, needs assessment, and decision-making
a - Detail the market vs general target segments
b - Describe Industry worth
c - How many potential customers are there?
d - How is the potential customer base changing?
e - Explain the target customers’ demographics
f - Detail the target customers’ psychographics
g - Detail the target customers’ geographics
h - Detail the needs of the target customers
i - Detail the drivers of the customers’ decision-making
j - What will make consumers choose this product
k - Are the target market’s decisions influenced by others
l - What impact will the product have on the target market
m - How much education & change will need to take place
n - Detail customers’ price and augmented product’s preferences
o - Detail service required
3 - Comprehensive profiles of a company’s target customers
4 - Detail any partners and partner’s decision making process or show there are none
D - Current marketing Situation Analysis
1 - Market overview/brief description & the company’s place in the market
2 - Product line overview
a - What other products does the company have?
b - Where does the new product fit into the existing line?
3 - External Analysis (SLEPT/Partial Porters)
a - Social (trends & their effects)
b - Legal (regulations, labor unions)
c - Economic
i - supply, demand, equilibrium
ii - vulnerability to preference changes
iii - fiscal, monetary, inflation, unemployment
d - Political (federal, local, favor of political party to industry, political changes)
e - Technological
i - evolution, choices available
ii - technological leads, innovation, can we keep up?
f - Industry
i - Show the leader in the market
ii - Show recent changes in power/trends in competition
g - Customers
i - How are demands changing over time?
ii - Is the company or consumer in power?
h - Suppliers
i - Show partners/value adding groups
ii - Is the company or supplier in power?
i - New industry entrants
i - How are the barriers to entry?
ii - Are there many new entrants?
4 - Internal Analysis
a - Resourced based view
b - Functional view
c - Value-chain
d - Competency matrix
e - Building blocks of competitive advantage
E - SWOT
F - Competitive Analysis
1 - Define what kinds of competition exist
a - Substitutes (direct)
b - In house or other (indirect)
2 - Describe competitors and show competitive advantage
a - Define each direct competitor individually
i - Strengths
ii - Weaknesses
iii - How do they satisfy the target market’s needs?
b - Group and categorize each major competitor
c - Describe the company’s competitive advantages
i - Efficiency
ii - Quality
iii - Innovation
iv - Responsiveness to customers
v - Providing incentives
vi - Access to limited or exclusive resources
G - Distribution overview
1 - Describe existing distribution channels and their effectiveness
2 - Describe trends in sales of similar products
3 - Overview of if the product will be sold in similar fashion to others
4 - Ordering
H - Place in the market
1 - Overview of company strategy
2 - List goals
3 - Issues affecting goal accomplishment
I - Marketing Strategy (What do to based on what was already stated/How to do it)
1 - Value Proposition/Product
a - Describe the core product
b - Describe the augmented product
c - What need will it satisfy
d - Why will a consumer choose this product?
e - Evolution of the product/it's successors
2 - Segmentation
a - Describe your market and detail how you will segment it
b - Justify why the market will be segmented in this way
c - Describe the segmentation variables and the segment’s differences
d - Describe why other segments are not being targeted
3 - The Rest of the Marketing mix
a - Price
i - Value of new offering
ii - Difference between new offering and what exists
iii - Pricing strategy
b - Place/distribution
i - Sales plan
ii - Sales forecast
c - Promotion
i - Acquiring customers
ii - Retaining customers
iii - Education
iv - Facts
4 - Marketing research needed
5 - Time Lines
J - Action & Control
1 - Action Program
a - List the first year’s initiatives
b - Estimate at what time each will be done in relation to other things
c - Estimate how long they will take
2 - Controls
a - What checkpoints are necessary to make sure everything is on track?
b - How will changes in the environment be handled?
c - What will be measured?
K - Conclusion
Some parts will be longer, others may only be a sentence or even be non-existent.
It's better to avoid 'I', 'we', and 'you', but if you find yourself frustrated or stumbling on these aspects, drop them in favor of smoothness. The meat of the plan and the part that will be of interest to most people will be that of section 'I', which may be the majority of the summary in section 'A'. The rest of the plan is backing, justification, and proof that section 'I' will succeed. Section 'I' explains the actual product, as well as the major assumptions.
A - Executive Summary
1 - State the product, it’s name, the company name, and who your market is
2 - Give a brief overview of the whole plan
a - Summarize assessments
b - Summarize goals
c - Summarize recommendations
B - Introduction
C - Customer Analysis
1 - Customer identification/definition
2 - Customer demographics, needs assessment, and decision-making
a - Detail the market vs general target segments
b - Describe Industry worth
c - How many potential customers are there?
d - How is the potential customer base changing?
e - Explain the target customers’ demographics
f - Detail the target customers’ psychographics
g - Detail the target customers’ geographics
h - Detail the needs of the target customers
i - Detail the drivers of the customers’ decision-making
j - What will make consumers choose this product
k - Are the target market’s decisions influenced by others
l - What impact will the product have on the target market
m - How much education & change will need to take place
n - Detail customers’ price and augmented product’s preferences
o - Detail service required
3 - Comprehensive profiles of a company’s target customers
4 - Detail any partners and partner’s decision making process or show there are none
D - Current marketing Situation Analysis
1 - Market overview/brief description & the company’s place in the market
2 - Product line overview
a - What other products does the company have?
b - Where does the new product fit into the existing line?
3 - External Analysis (SLEPT/Partial Porters)
a - Social (trends & their effects)
b - Legal (regulations, labor unions)
c - Economic
i - supply, demand, equilibrium
ii - vulnerability to preference changes
iii - fiscal, monetary, inflation, unemployment
d - Political (federal, local, favor of political party to industry, political changes)
e - Technological
i - evolution, choices available
ii - technological leads, innovation, can we keep up?
f - Industry
i - Show the leader in the market
ii - Show recent changes in power/trends in competition
g - Customers
i - How are demands changing over time?
ii - Is the company or consumer in power?
h - Suppliers
i - Show partners/value adding groups
ii - Is the company or supplier in power?
i - New industry entrants
i - How are the barriers to entry?
ii - Are there many new entrants?
4 - Internal Analysis
a - Resourced based view
b - Functional view
c - Value-chain
d - Competency matrix
e - Building blocks of competitive advantage
E - SWOT
F - Competitive Analysis
1 - Define what kinds of competition exist
a - Substitutes (direct)
b - In house or other (indirect)
2 - Describe competitors and show competitive advantage
a - Define each direct competitor individually
i - Strengths
ii - Weaknesses
iii - How do they satisfy the target market’s needs?
b - Group and categorize each major competitor
c - Describe the company’s competitive advantages
i - Efficiency
ii - Quality
iii - Innovation
iv - Responsiveness to customers
v - Providing incentives
vi - Access to limited or exclusive resources
G - Distribution overview
1 - Describe existing distribution channels and their effectiveness
2 - Describe trends in sales of similar products
3 - Overview of if the product will be sold in similar fashion to others
4 - Ordering
H - Place in the market
1 - Overview of company strategy
2 - List goals
3 - Issues affecting goal accomplishment
I - Marketing Strategy (What do to based on what was already stated/How to do it)
1 - Value Proposition/Product
a - Describe the core product
b - Describe the augmented product
c - What need will it satisfy
d - Why will a consumer choose this product?
e - Evolution of the product/it's successors
2 - Segmentation
a - Describe your market and detail how you will segment it
b - Justify why the market will be segmented in this way
c - Describe the segmentation variables and the segment’s differences
d - Describe why other segments are not being targeted
3 - The Rest of the Marketing mix
a - Price
i - Value of new offering
ii - Difference between new offering and what exists
iii - Pricing strategy
b - Place/distribution
i - Sales plan
ii - Sales forecast
c - Promotion
i - Acquiring customers
ii - Retaining customers
iii - Education
iv - Facts
4 - Marketing research needed
5 - Time Lines
J - Action & Control
1 - Action Program
a - List the first year’s initiatives
b - Estimate at what time each will be done in relation to other things
c - Estimate how long they will take
2 - Controls
a - What checkpoints are necessary to make sure everything is on track?
b - How will changes in the environment be handled?
c - What will be measured?
K - Conclusion
Brand: It's All In Your Head 16 July, 2010
A company's brand is simply what a consumer thinks of a company and it's products. It represents a set of promises that a company makes to a consumer.
Brand equity consists of assets and liabilities linked to a brand that change the value of a product. It can also be thought of as the value of the company if the firm's total asset value was subtracted from the firms estimated value.
Building a brand can trump everything else in marketing, for better or for worse. Brands have the ability to create customer loyalty, lower competition, create larger margins, lower price sensitivity of products, create greater trade, create better communication effectiveness, and create brand extension opportunities.
The key to branding: The power of a brand is in the mind of the consumer
From a practical standpoint, consumers will rate a brand based on three things:
1 - The expertise of the company
2 - The similarity of products produced
3 - The absence of brand extension exploitation
Many characteristics and features that augment a product, such as warranty time, can affect branding. Popular culture, influencers, customers, and the firm can influence the culture or story behind a brand.
The value of a brand can be measured in four parts:
1 - Reputation
2 - Relationship
3 - Experience
4 - Symbolism
The Young and Rubicam Group have four ideas that when measured, can determine the health of a brand:
1 - Differentiation
2 - Relevance
3 - Esteem
4 - Knowledge
When differentiation is greater than relevance, the brand can grow. Otherwise, it cannot. When esteem is greater than knowledge, the customer will want a closer relationship. Otherwise, it will not. Brand strength is the combination of differentiation and relevance. Brand stature is the combination of esteem and knowledge.
Kevin Keller developed a model called the Customer Based Brand Equity (CBBE) Pyramid. It has the goal of allowing a company to:
1 - Decide what the brand should mean
2 - Develop a link between the brand and the product
3 - Get positive reactions
4 - Build lasting customer relationships
Brand equity consists of assets and liabilities linked to a brand that change the value of a product. It can also be thought of as the value of the company if the firm's total asset value was subtracted from the firms estimated value.
Building a brand can trump everything else in marketing, for better or for worse. Brands have the ability to create customer loyalty, lower competition, create larger margins, lower price sensitivity of products, create greater trade, create better communication effectiveness, and create brand extension opportunities.
The key to branding: The power of a brand is in the mind of the consumer
From a practical standpoint, consumers will rate a brand based on three things:
1 - The expertise of the company
2 - The similarity of products produced
3 - The absence of brand extension exploitation
Many characteristics and features that augment a product, such as warranty time, can affect branding. Popular culture, influencers, customers, and the firm can influence the culture or story behind a brand.
The value of a brand can be measured in four parts:
1 - Reputation
2 - Relationship
3 - Experience
4 - Symbolism
The Young and Rubicam Group have four ideas that when measured, can determine the health of a brand:
1 - Differentiation
2 - Relevance
3 - Esteem
4 - Knowledge
When differentiation is greater than relevance, the brand can grow. Otherwise, it cannot. When esteem is greater than knowledge, the customer will want a closer relationship. Otherwise, it will not. Brand strength is the combination of differentiation and relevance. Brand stature is the combination of esteem and knowledge.
Kevin Keller developed a model called the Customer Based Brand Equity (CBBE) Pyramid. It has the goal of allowing a company to:
1 - Decide what the brand should mean
2 - Develop a link between the brand and the product
3 - Get positive reactions
4 - Build lasting customer relationships
Figure 1 - CBBE Pyramid

The definitions that follow describe the CBBE pyramid, and can be though of in terms of understanding nomenclature. To communicate an idea, sometimes certain words or phrases are used, and in the beginning, synonyms are the only way a person has of understanding what the initial words or phrases mean. The following definitions will be defined by their synonyms because it seems this is the most effective way to talk about these brand ideas.
Brand Salience - Identity & awareness. It shows what basic functions the brand provides. It also allows the consumer to see new usage situations that were previously ignored or forgotten.
Brand Performance & Imagery - Meaning & associations. Performance is all about functional needs. This includes quality, utility, asthetics, and economic needs. It includes primary and secondary functions as well as reliability, servicability (effectiveness, efficiency, and empathy), and durability. It also includes style, design, and price.
Imagery is all about psychological and social needs. It is about user profiles, purchase scenarios, usage scenarios, personality, values, history, heritage, and experiences.
Both Performance and imagery can be profiled by looking at three main categories: Strength, Favorability, and Uniquness in that order.
Consumer Judgements & Feelings - The effects that the knowledge and product a company publicizes has on consumers. Quality, credibility, consideration, and superiority are judgement attributes. Warmth, fun, excitement, security, social approval, and self-respect are feeling attributes.
Consumer Brand Resonance - Brand loyalty. This means behavior loyalty, bonding attitudes, a sense of community, and active engagement.
A consumer cannot have brand loyalty to all the brands they come in contact with. This is due to both conflicting allegiances and personal differences and preferences. This links nicely with Jennifer Aaker's theory on brand personality. The theory states that if people choose friends based on personality, they should be able to choose products and services based on some similar personality. Doing this generally involves surveys that ask questions falling into the following categories (thus showing a product's personality) :
1 - Sincerity
2 - Excitement
3 - Competence
4 - Sophistication
5 - Ruggedness
Another method used in gaining consumer insights is the ZMET (Zaltman Metaphor Elicitation Technique). This method has a consumer gather images about a brand or product, and then use those images to tell a story. Missed images, sensory images, and image groups are also discussed. This method's main benefit is removing the constraints on voice/language and the asking of specific questions in gaining insights. It helps consumers say what they want to without putting their ideas into words.
The Link Between Consumers and Brands - A brand should help a consumer remember and understand the differences between a competitors brand and your brand.
Brands should:
- Suggest something about the product's benefits and qualities
- Be easy to pronounce recognize and remember
- Be distinctive
- Be extensible
- Translate into foreign languages
- Be capable of registration and legal protection
Brands must continually be built even if they are already strong. Competitive and consumer shifts can occur, and change everything. The time it takes to build a brand will be proportional to the time it takes to create enough awareness and understanding with consumers. In the end, it's what the consumer thinks that makes or breaks a firm.
Marketing and the Yardstick 15 July, 2010
Why should anyone measure marketing? The 'why measure' answer is pretty obvious, but the fact that marketing is being measured is interesting. Marketing costs a lot. Brand health + marketing = the company's reputation. Finally, the customer is usually the source of all cash for the company.
It's important to ask how the customer's needs are changing, how the firm can be loyal to the customer, and how marketing effectiveness can be measured in terms of the bottom line.
One way to create and understand measurements is by using a dashboard. A dashboard is simply a set of indicators that can be glanced at and absorbed quickly. There are several points to be made when talking about dashboards. Not a lot of explanation is needed. Use the following list as a dashboard creation guide, and the result will be above average.
- Don't overload it with too much information.
- Include operational, financial, customer, and quality metrics.
- Include driver, pipeline, resource, and talent information.
- Include innovation information.
- Show how the entire company as a whole is doing.
- Visualizations should be simple and easy to digest.
- Use a combination of historical data and leading indicators.
- Focus on leading indicators.
- Metrics should be as real time as possible.
- Only show controllable metrics.
- Use baselines to allow the flagging of extraordinary results.
- Echo corporate strategy in the metrics.
- Measure short and long term goal metrics.
- Create standard definitions for metrics.
- Verify metrics are absolutely correct.
- Allow for an audit trail to see the details.
- Casual (cause and effect) measurements should be used.
- Verify that the metrics matter.
- Measurement methods must be consistent across the company.
- Results should be shared.
- Results should be acted upon.
- Metrics should expose inadequacies.
There's the list.
Subscribe to:
Posts (Atom)