Pages

What most people call the 'org chart' 30 March, 2011

Organizational design describes how an organization is configured. It helps assign tasks and roles to people. It also allows people to integrate ideas and communicate. A few main components of organizational design are:
  • Reporting relationships
  • Reward systems
  • Rules and procedures
  • Communication methods
  • Job specialization
  • Decision making methods
  • Learning
  • Distribution of authority
One way to organize and setup these components is to follow the “Structure should follow strategy” mantra. Look at what the strategy is, and design the previous components accordingly. When many people think of organizational design, they think of the structure component (the “org chart”). This may be due to the difficulty in thinking through many of the organizational design components. Instead of customizing the level of each component to a strategy, many people use a canned or popular default organizational structure. Default structures help determine how organizational components are designed.

Before describing popular organizational structures, it should be noted that all organizational structures can fall within a spectrum. One end of this spectrum is labeled ‘Mechanistic’, and the other end is labeled ‘Organic’. Mechanistic organizations are considered to be closed to their environment because they cannot adapt or deal with complexity. Organic organizations on the other hand, are considered to be open to their environments because they can adapt and deal with complexity.

Typically, mechanistic structures have the following characteristics:
  • Many levels of management
  • Centralized decision making
  • Many processes and procedures
Mechanistic structures are the most common because the first enterprises were patterned after the Army which had a very strict chain of command.

Organic structures usually have these characteristics:
  • Few levels of management
  • Decentralized decision making
  • Few formal processes and procedures
Here is where each of the following default structures lie on the mechanistic-organic spectrum.

Simple:
This is generally used by small businesses or startups. Although they can be quick to respond, adaptations come in small iterations. They cannot handle complexity and usually bottleneck when coordinating with ‘the boss’.

Functional (Unitary-Form):

This form organizes people based on their skills. It can deal with more complexity than simple organizations because of the specialization groups that employees are in. Each department however, has a hard time seeing the big picture which involves the other departments and their concerns. Processes are usually required to facilitate or force coordination between departments. This is generally the most common. This structure promotes centralization.

Conglomerate (Holding-Form):
A conglomerate is a set of unrelated businesses and based on departmentalization. Each of these businesses could be further categorized.

Divisional (Multidivisional-Form):

Instead of creating departments based on skill, departments are created based on geographical regions, customer groups, or product groups. Customer needs can be better met with this type of structure. Divisional structures are scalable and do not force employees to specialize. Administrative costs rise because each department could be a miniature functional company. Divisional structures can adapt and deal with complexity better than functional structures because a divide and conquer approach is present. These organizations start sharing resources.

Matrix:

A matrix structure tries to get the best of both worlds by superimposing a functional structure on top of a divisional structure. High levels of communication and coordination are present, but this comes at a higher cost. Less time is spent supervising, but decisions may take longer because consensus from a diverse group will be harder to achieve.There are also usually two bosses which can cause confusion. This structure takes full advantage of its human resources.

Project/Team:

Like matrix structures, team organizations are hybrid structures, but with only one boss per person. They adapt well, and can handle complexity well. They are very costly to operate. There is often forced collaboration because teams are made up of multiple skill sets. People can easily move from project to project when they are needed, and this transient behavior helps transfer information throughout the company.

Network:

The network organization is one which is almost exclusively made up of partnerships and outsourcing. These partnerships and outsourcing contracts can easily be renewed, replaced, or removed. Sometimes called a virtual corporation, it can be accommodating but can also be a communications nightmare. Many online companies take this form.

The following factors can help determine how mechanistic or organic an organization should be:
  • Stability of the industry
  • The pace of industry innovation
  • Number of products
  • Number of competitors
  • Number of external partners
  • Number of employees
  • Number of clients
  • Internationalization
  • Company culture

If a company wants to change its structure to fit its strategy, the company culture will probably determine whether the effort will succeed or fail. Often the level to which an organization can be organic will be determined by the self-motivation of its people and their ability to understand each other.

Getting What You Want: Negotiating 27 January, 2011

Getting what you want is an important skill. However, it is shadowed by the skill of conceding only what you must while keeping relationships in tact. Winning really means satisfying interest. Much of what follows is based on the work of Roger Fisher and William Ury, although I have tuned much of it to be what I feel is relevant. Lets begin by defining negotiation.

Negotiation:
  • Dealing with differences and needs
  • Getting more
  • Satisfying a need you cannot get on your own
  • Building relationships that benefit all parties (debatable by some)

There are two main schools of thought when it comes to negotiating. The first, and most common, is bargaining. Academically, it is referred to as positional negotiating. In this kind of negotiation, parties believe that there is a fixed amount of value that can be claimed. Each party tries to get as much value as possible. The second kind of negotiation is sometimes referred to as integrative. In this second kind of negotiation, parties believe that it is possible to create new value in addition to what is up for negotiation and then have parties claim the parts that are important to them.

A classic example of the difference in these two negotiation styles is two children that both want an orange. In distributive negotiation it would be fair to cut the orange in half. Integrative negotiation however, would look to the interests of the two children to discover that one child wanted to make orange juice from the fruit, and the other child wanted to use the rind to make a cake. Here on child would get the entire peel and the other child would get the entire fruit, with both children being better off than the standard bargaining and fairness models.

There are hybrid models of course, where one party bargains and the other tries to create value. Most research suggests that when one party sticks to value creating negotiation, the other party can be convinced to do the same. Some authors like Jim Camp, argue that trying to attain a win-win situation brings in too much emotion and allows you to be taken advantage of. If the parties remove irrational emotion from the equation and really focus on what is going on.

Differences in belief, or even different interpretations of a fact make deals possible (eg: buying and selling stocks). To understand these differences pre-negotiation preparation and during-negotiation preparation is a key. Lack of preparation is the biggest problem in negotiating. Having said this, keep in mind that the amount of prep required should be proportional to what is at stake.

Planning Steps
  • Know the other group's culture and beliefs
  • Determine interests and good outcomes for each party
  • Identify differences and opportunities for trade
  • Identify each party's best alternative to the negotiation
  • improve your best alternative before and during the negotiation
  • Negotiate with those who can make the decision
  • Be patient
  • Acquire external standards for top and alternate possibilities

The Negotiation
  • Distinguish personalities from the problem
  • Focus on interests
  • Explain your interests as they explain theirs
  • Generate more options
  • Listen carefully, expressing empathy when needed
  • If your best alternative is weak, don't divulge it

Tactics
  • Recognize malicious tactics and call them out
  • Present interests first, then the proposal
  • Praise for something still under way makes a person want to keep doing it
  • If you think the other party can improve their alternatives, put an expiration on the offer

If Things are not Progressing
Ask "How might the other side be criticized if they made the negotiation?".

If Your Ability to Trust is Questioned
Try something like "I don't think it is a question of trust, I think it is a question of making sure we are on the same page".
Also, "It is not about trust, it's about everyone feeling like there is a fair deal".

Making it Easy to Say Yes Without Sounding Like a Threat
Attribute the statement to standards or established facts. Be careful of the phrasing and bring up the importance of the relationship between the two parties.

You Need More Information
Silence can be powerful and act as a smooth rejection of what was just said. It can also make the other party feel like they need to back up what was just said with more information. Talking specifically to people who have less authority to make decisions and are not as worried about keeping quiet on certain topics can bring you more information.

The Negotiation's Initial Direction is a Problem
Statistically, the first offer correlates with the final agreement. Putting the first offer on the table can help drive the whole discussion but you must be able to back it up. If another party makes a proposal first, bring in standards that are in your favor, bring up interests, and then put your offer on the table.

Things to Keep in Mind
Along with general negotiating practices and tactics, there are several ideas whose diversity keeps them from being categorized. Even though they may be smaller, individual ideas, they should not be underestimated. For exanple: Don't attack or defend. The more you can remove irrational emotion from the negotiation, the better chance you will have of being able to concentrate on satisfying both parties.

Make yourself open to correction. Remember that those with whom you are negotiating are people and have the same basic human needs that you do. People do not like to be threatened, told they are wrong, or insulted. Also, don't assume that your worst nightmare is the other party's top priority. Thinking in this way only allows value to be claimed, not created.

When comparing two options or one option to a standard, it is important to have some value associated with the differences. The benefit of having a defined point at which you will walk away is debatable. Some critics argue that it impedes new option generation, while the other side claims that you leave yourself open to an end result that is less desirable than if you had not negotiated. If you do subscribe to having a reservation price, it can be determined by looking at your best alternative and then adding the value of any extras.

There is a difference in knowing what consessions to make and when to make them. When getting ready to make a consession, make sure it is really worth it. if you are unsure about the concession and it is a big deal, you can always take a break to think. If the other side is making a concession, keep in mind that bigger concessions show that a party is more flexible while smaller concessions show that a party is less flexible.

Overcoming Cultural Differences
Geert Hofstede created five scales that help determine the attributes of a person. Although thoroughly understanding everything about someone's personality is probably not your objective, some important observations can be made (eg: is the person more fact oriented or relationship oriented).

The following is a list of the five scales and a brief description of each:
  • Power distance: Are all people equal in authority?
  • Individualism: The preference of individuals or groups
  • Uncertainty avoidance: The resistance to change
  • Masculinity: Assertiveness or dependence
  • Long term orientation: Long vs short term

Even though you can't give the other side a personality test to fill out, you can identify some of these elements based on geographical averages and organizational culture. By looking at jargon, dress code, rituals, ceremony, layout, and values (Hofstede helps here) you can tell what is important to that person. From this you can get a better picture about what they are willing to do and trade.

Negotiating is a useful art that takes practice to master. Understanding these elements will help guide that mastery as you run into opportunities to practice.

Time & Money: Best Friends or Worst Enemies 06 January, 2011

If the most powerful force in the world is compound interest as Albert Einstein once said, it should probably be a factor in investment decisions. Understanding the way in which time and rates of return affect money and projects will significantly help when determining whether or not to pursue a project or which project to choose.

Because this area of valuation is critical, it has been refined quite a bit. We need to start with some definitions in order to keep straight how everything interacts and how this valuation happens.
  • Annuity - A set of fixed payments that happen over a period of time (loan, lease, etc.)
  • Present Value (PV) - The present value of future cash
  • Future Value (FV) - The future value of present cash
  • Discount rate - a rate used to find the present value of future cash
  • Net Present Value (NPV) - the difference between what something costs, and what it provides when discounted to PV
  • Discounted Cash Flow (DCF) Analysis - calculating cashflows and determining if their NPV > 0

Why do we care about discounting money to present values? Because projects and investments do not instantaneously finish and mature; They do so over different periods of time. Because of this, we must adjust them for the time value of money.

Here are the most important formulas used when dealing with PV, FV, and annuities.

PV / FV Formula
Ordinary annuity formulas
r = the interest rate / 100 (6.5% = .065)
n = the number of periods (months, years, etc.)
c = total payment
Annuity PV/FV = total principal


In practice, people generally use something like Excel rather than the formulas to compute these values. Excel does have these built in and labels the functions pv, fv, and pmt.

The discount rate, used as the rate (r) parameter in the preceding formulas, can be arbitrarily set to some required rate. The most commonly used discount rate is the cost of capital, specifically the Weighted Average Cost of Capital (WACC). The WACC is made up of the weighted cost of debt and equity or in other words, what currently satisfies debtors and shareholders.

These formulas can be used to put money at different times on the same playing field and allows for true comparison. The annuity formulas are also useful for everyday calculations such as mortgage payments.

Tracking Sustainability 03 January, 2011

The end goal of finance and accounting is to keep records, and make sure activities are sustainable for some given period. This happens when costs are examined and budgets are created.

Some methods for cost analysis are the following:
  • Process Costing - Assigning unit costs to items created with a process that does not stop when part of a single unit is completed
  • Variable Costing - Segregating fixed costs and variable costs on a per unit basis
  • Activity Based Costing (ABC) - Another alternative method of tracking costs in order to see how profitable a product or customer is. All activities are assigned a cost. A percentage of each activity used to create a product or service can then be summed for an overall cost.
Budgets are used to regulate work done and money spent. Budgets are also where most assumptions that are made come into play. The two main goals of any budget are planning and control (goals and satisfying goals).

A general master budget can be broken up into many smaller budgets. This helps organize the task and ensure its correctness.


Example Master Budget System


Example Sales Budget

An additional step that is often used when creating a budget is that of flexible budgets. A flexible budget is a budget based on activity ranges. Instead of creating one possible sales figure, or production figure, a few range or checkpoint numbers are chosen and a budget line is created for each of these.

Accounting & Finance: It's Not Black and White 22 December, 2010

Everyone knows that finance and accounting deals with money. What they don't know is that these two subjects are not black and white. Assuming ethical behavior is taking place, there are three factors that make the numbers not so obvious, predictable, or in other words, black and white.

First, the interpretation of many measurements can vary because there is not a globally accepted way to calculate everything. Not only are there different accounting standards from country to country, the best way to calculate many financial ratios differs depending on who you talk to. There are also different algorithms to calculate items such as depreciation and inventory attributes. Knowing the general theory behind many financial ratios can lead to a more correct interpretation.

Second, assumptions are used to predict elements that are unknown. These assumptions are best guesses by individuals that themselves may not have all relevant information. Aside from discussions or critical thinking, assumptions can also come from a probability analysis based on best and worst case outcomes. A common simulation used to create these assumptions is the Monte Carlo method.

Third, the availability of inside information may not be widely known, but may contribute significantly to changes in the numbers. This factor can be hedged by having an understanding of annual and quarterly reports. One of the most important parts of annual and quarterly reports, besides the actual financial statements, is the Management Discussion and Analysis (MD&A). Management is required to divulge any important risks, benefits, or other factors that could affect the current state of the company or any official projections that have been made.

Show Me the (Real) Money

There are several things that everyone should know about a company in terms of its finances. The most important aspect of a company's finances is usually all about valuation.

Many people think of stock price as the major financial indicator for how a company is doing at the minute. In reality, stock price is a supply and demand for a share of a company that represents all future profits and growth. It's valuation.

Valuation has many facets which include relative comparisons to industry averages. It also includes cash flow, sustainable growth (internal and external), and general ratio analysis. Although there are macro economic factors like substitute products that can affect a company's value, most of the elements that a company can control are embedded in their financial statements.

Financial statements are required for publicly held companies and usually take the form of 10-Q and 10-K filings. There are other filings for non US-based companies, but they are very similar to the 10-Q/K statements. While there are also 8-K statements that show important changes and announcements a company is making, 10-Q/K statements show the major financial statements and other important information about the company. The 10-Q/K statements are created on a quarterly (Q) and annual (K) basis.

The major financial statements included in 10-Q/K filings are the Income Statement (Profit and Loss or P&L), the Balance Sheet (Statement of Financial Position), and the Statement of Cash Flows. Each of these statements has its own purpose, but interacts heavily with the others.

For each statement, there is a general accounting equation that describes the content:
  • Income Statement: Revenues - Expenses = Profit/Loss
  • Balance Sheet: Assets = Liabilities + Shareholder's Equity
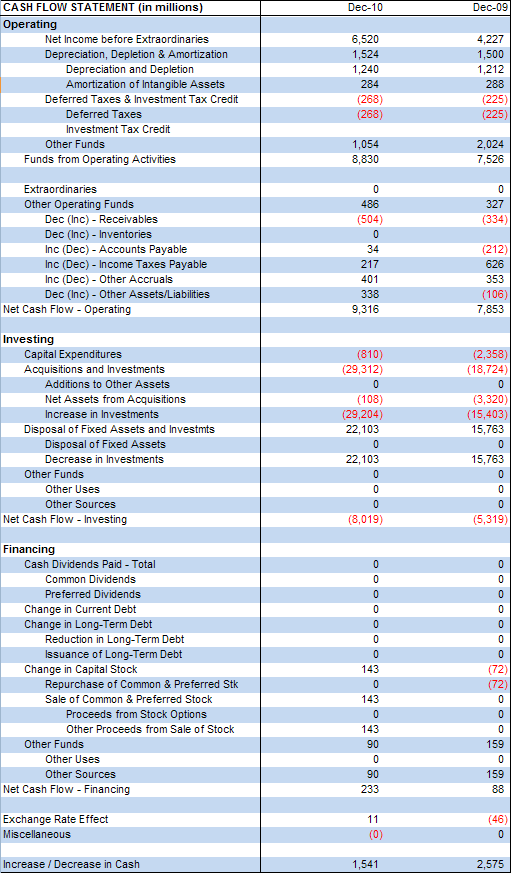
  • Statement of Cash Flows: Operating Cash + Investing Cash + Financing Cash + Beginning Cash = Ending Cash
Example Income Statement

Example Balance Sheet

Example Cash Flow Statement


Financial Ratios are created from line items of the three financial statements previously mentioned. They can be grouped into six categories:

Liquidity
  • Current Ratio
  • Quick Ratio
  • Debt to Equity Ratio
Activity / Asset Management
  • Receivables Turnover
  • Fixed Asset Turnover
  • Total Asset Turnover
  • Days of Sales Outstanding (DSO)
Debt Management
  • Debt Ratio
  • Times Interest Earned (T.I.E.) Ratio
  • Fixed Charge Coverage Ratio
Profitability
  • Net Profit Margin
  • Return on Assets (ROA)
  • Return on Equity (ROE)
Market Value
  • Price to Earnings (P/E) Ratio
  • Cash Flow per Share Ratio
  • Book Value per Share Ratio
  • Market to Book Ratio
  • Economic Value Added (EVA)
  • Market Value Added (MVA)
  • Internal Growth Rate (IGR)
  • Sustainable Growth Rate (SGR)
  • Price-to-Earnings to Growth (PEG) Ratio

Ratio calculation

There are many more ratios, but these are used quite a bit. There are expansions on ratios such as P/E -> PEG. One additional expansion ratio not previously mentioned that does carry some fame is the DuPont expansion of ROE. Its purpose is to give a better idea of what contributes to ROE by showing that ROE can be expanded to three separate other ratios if identical numerator/denominator pairs are not canceled out:


It is important to note that while the theory of each financial ratio is generally the same, they are sometimes calculated differently and must be compared only to other ratios that have been calculated in the same manner.

A company comparison using ratios

Again, it is important to stress that when making numeric comparisons, things are calculated in the same way. Use the numbers, management comments, and any other information you have, but remember that you will ultimately be making decisions based on this information and you must both understand it and take it with a grain of salt. Everyone ends up having their own interpretation.

Strategy Performance Part II 09 December, 2010

Even though most people are concerned about their own health, I'm guessing that a small percentage of those people don't really think about the health of the company they work for. I would argue that although many employees are constantly searching for that next innovation, simple process improvement would improve the average company just as much.

Process improvement is not only about improving, it's also about knowing what is possible. A process is working well if it consistently performs well, and has a low level of daily variance. When looking at a company checkup in terms of its process health, the investment in improvement is not as expensive as first impressions may indicate. In fact, many studies show that it is not the willingness or ability to improve, but the time required that is often the problem.

Four main goals of process improvement are:
  • Cutting costs
  • Cutting waste
  • Improving quality
  • Removing stress

Two popular ways of improving processes are benchmarking and waste identification. Either way, it's all about removing things that do not add value and adding more value where it is needed.

Benchmarking is all about using metrics to grade a process. These grades can then be compared to either other internal benchmark grades or external benchmark grades dealing with similar processes. Internal comparisons are used for continuous improvement from where the company was previously at. External comparisons are used to find out how well a process compares to the best versions of those processes on a local, national, or even global scale.

Benchmarking and process improvement is comprised of the following steps:
  • Talk to those dealing with the process (to gain information and buy-in)
  • Create metrics for comparing improvement levels
  • Collect metrics before a change (as the process exists today)
  • Make the change
  • Collect metrics after a change
  • Make sure the improvements and measurements are statistically significant
  • Present findings, real world benefits, and recommendations
  • Officially incorporate the changes into the process
  • When needed, benchmark again for continued improvement
Measurement methods chosen should usually be standard to keep bias out of the question. Some possible measurements include:
  • Time
  • Number of people involved
  • Number of manual steps
  • Number of communication methods or problems
  • Amount of redundancy
Waste identification attempts to identify for removal all resource expenditures that do not create value. There are eight distinct types of waste that may exist:
  • Transportation (moving things more than needed)
  • Inventory (any unneeded storage or depreciation)
  • Motion (people moving more than needed)
  • Waiting
  • Over production (making more than needed)
  • Over processing (poor tool use)
  • Defects (taking extra time to find defects and fix them)
  • Underutilized resources
When benchmarking or identifying waste, it is important that precise documentation is kept. Several popular documentation techniques include:
  • Process Diagrams & Value Stream Mapping
  • Cause and Effect (also known as either Fishbone or Ishikawa diagrams)
  • Pareto Charts / Analysis
Process diagrams are simply what they say they are. A flow of beginning to end for a process. This includes preparation for the process, the process, and any cleanup. It also includes inputs, outputs, capacities, times, and bottlenecks. It is sometimes a good idea to limit the process to be improved to just a portion of the whole process if it is very complex or big. In this case it is common to Plan, Do, Check, and Act (PDCA). PDCA is really just a business version of the scientific method.

Cause and Effect diagrams are useful for finding root causes to problems. Looking at the following diagram, you can see why some people call it a fishbone diagram. Every time there is a reason for the effect, an attempt is made to find a lower level cause.


Pareto charts are cross plots of specific problem types vs total problems (relative vs. absolute). They are useful in showing which problem areas should be addressed first.
If it is uncertain whether a process needs to be benchmarked or improved, try looking at that process from a customer's perspective and see if you would be impressed or left wanting.